Ballpark adjustment to GDPNow:
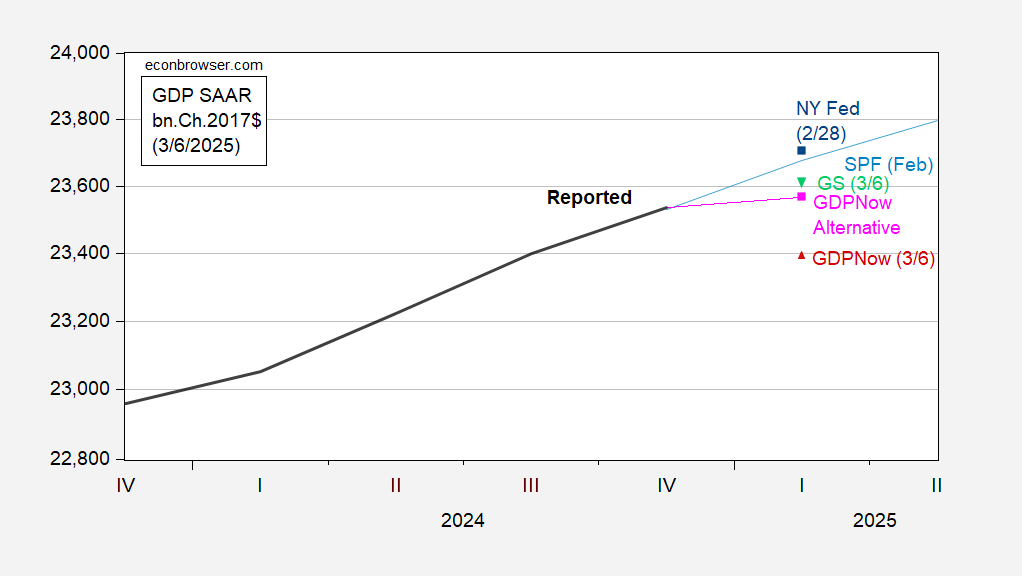
Figure 1: GDP (bold black), February SPF median (light blue), NY Fed nowcast of 2/28 for Q1 (blue square), GDPNow nowcast of 3/6 (red triangle), Alternative GDPNow holding import effect of 2/28 to GS estimate (pink square), Goldman Sachs tracking of 3/6 (light green inverted triangle), all in q/q AR, %. Source: BEA, Philadelphia Fed, NY Fed, Atlanta Fed, Goldman Sachs, and author’s calculations.
The adjusted GDPNow growth (q/q AR) is +0.55%, still essentially just above zero.
I understand that gold imports are through the roof, but I’m not sure why that changes the GDP outcome. Gold counts as a current account transaction, but not against GDP? It’s like existing home sales?
Looks like gold imports and exports ARE excluded from GDP calculations. How naughty of the Atlanta Fed to have missed that…
From what I understand, asset acquisitions such as gold or stocks, are not included as investment in GDP. Therefore they do not offset the import cost.
It would seem that it would make sense to ignore gold imports unless they are used in manufacturing processes or jewelry. Is a gold coin a non-GDP asset or a GDP collectable? But unless there is as distinction between gold destined to assets and gold as a product input, then subtracting all gold imports from GDP would introduce an error term.
So the question is how gold is accounted for on both sides of the GDP equation.
maybe i’m missing something, but i don’t understand why gold imports are even an issue; the $585 million increase in our imports of nonmonetary gold shown in today’s report was less than 2% of the January goods import increase; contrast that with the $20,481 million increase in our imports of finished metal shapes…
I’m not all that clued in on categories of goods in international trade, but “finished metal shapes” includes everything from gold bars to rebar. Whether gold bars are “nonmonetary” is perhaps the issue here.
Anyhow, here’s imports from Switzerland:
https://fred.stlouisfed.org/graph/?g=1EeNV
Notice the gargantuan increase in January. I don’t think we buy rebar from Switzerland.
i don’t know of any place in that 57 page report where it breaks down what imports came from where, but i could have missed something: https://www.bea.gov/sites/default/files/2025-03/trad0125.pdf
however, the press release for this month’s report summarizes Exhibit 19 in the full pdf, which gives us surplus and deficit details on our goods trade with selected countries…”The deficit with Switzerland increased $9.8 billion to $22.8 billion in January. Exports increased $0.6 billion to $1.8 billion and imports increased $10.3 billion to $24.6 billion.”
so at the most, Switzerland could have only accounted for half of the $20.5 billion increase in our imports of finished metal shapes…
as an aside, using exhibit 10, which gives goods imports in 2017$, i figure January imports are rising at an 85.9% annual rate over the 4th quarter..
(285,184 / ((234,628 + 244,332 + 253,764)/ 3)) ^ 4 = 1.85876282
that’s a pace that would subtract roughly 9.15 percentage points from 1st quarter GDP, if it were to continue thru Feb & March, possible considering that Trump has delayed most tariffs till April 2…those imports should add to national account inventories, but there’s no evidence of that yet…adjusted with PPI indices, factory inventories were down modestly, and wholesale inventories were flat. so January GDP looks to be down about 10%