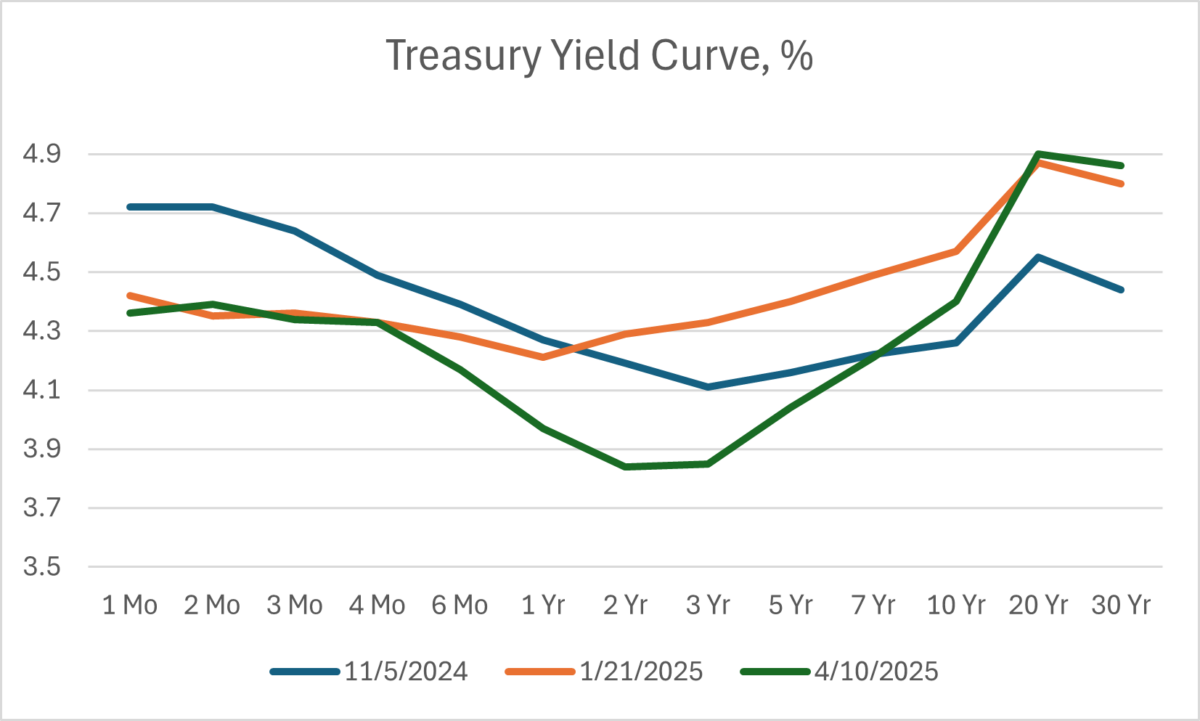
The yield curve looks like this as of today’s close:
The EHTS implies that in 6 months, the 6 month Treasury yield will be 3.77%, compared to the current 4.17%. That is, yields will be 40 bps lower.
That suggests close to 2 cuts within the next six months…

I would offer one bit of caution. In a market partly driven by forced unwinding of investment positions, there is a shift toward more noise, less signal, in financial data.
While I am very interested in inflation expectations implied from Treasury rates, and in term premium, there’s a good chance that those data are misleading right now. We extract more information, less noise, when trading is less volatile.
I point this out especially because we continue to see what Menzie earlier noted is “steepening *and* inverting”. I don’t have a front-row seat, but that looks like forced liquidation to me.
I think tariffs will lead to an increase in inflation over the longer term. If the inverted, steepened curve reflects that view, dandy, but financial reporting suggests forced selling.
The 10 year has gone from 4% to 4.5% in the past week. Who is selling?
The $ is weakening who is selling?