As of close today:
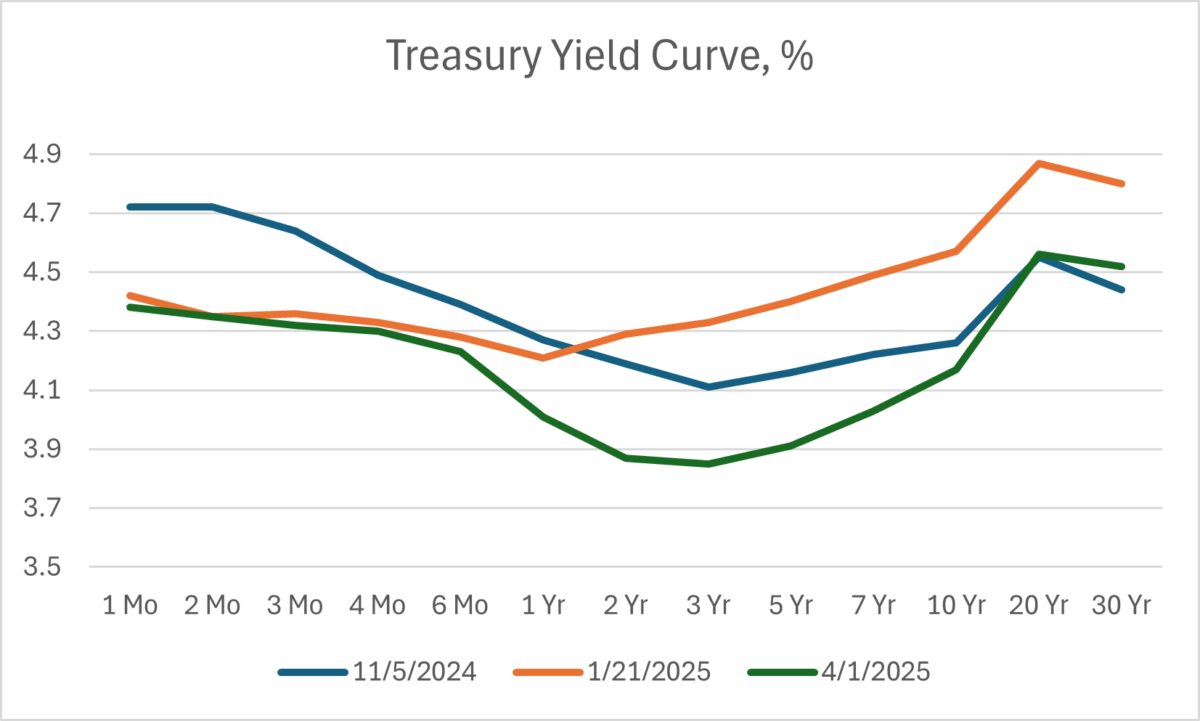
Figure 1. Treasury yield curve, %. Source: US Treasury.
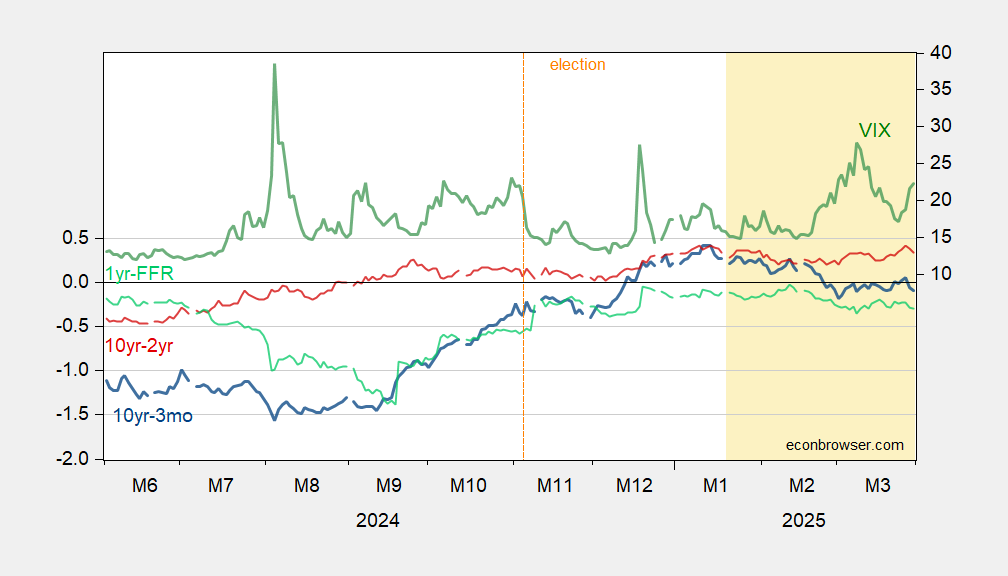
Figure 2: 10yr-3mo Treasury term spread (blue, left scale), 10yr-2yr Treasury term spread (red, left scale), 1yr-Fed funds (light green), all in %, VIX at close (green, right scale). Source: Treasury, CBOE via FRED.


I’m old so I can repeat myself as an old yield curve junkie , you only take note of inversion when your central bank starts raising official cash rates.
Hey Chinny why am I on moderation?????
Not Trampis: Traveling today – first time I’m on Econbrowser to aprove comments, just now…
Simply wrong. For a number of reasons. I’ve explained before, but here ya go:
The Fed has raised rates. The Fed has also lowered rates. If you are going to insist on a simple rule of thumb, then historically, recessions follow a pattern of the Fed raising AND THEN LOWERING rates.
The yield curve is predictive in part because of a wisdom-of-crowds element. Market participants anticipate Fed rate cuts and bid down market interest rates in anticipation of those cuts. That anticipation grows out of the expectation of weakening economic performance. That isn’t a mere rule of thumb. That’s the logic of yield-curve behavior. You keep insisting on only paying attention to your incomplete rule of thumb.