Preliminary data today:
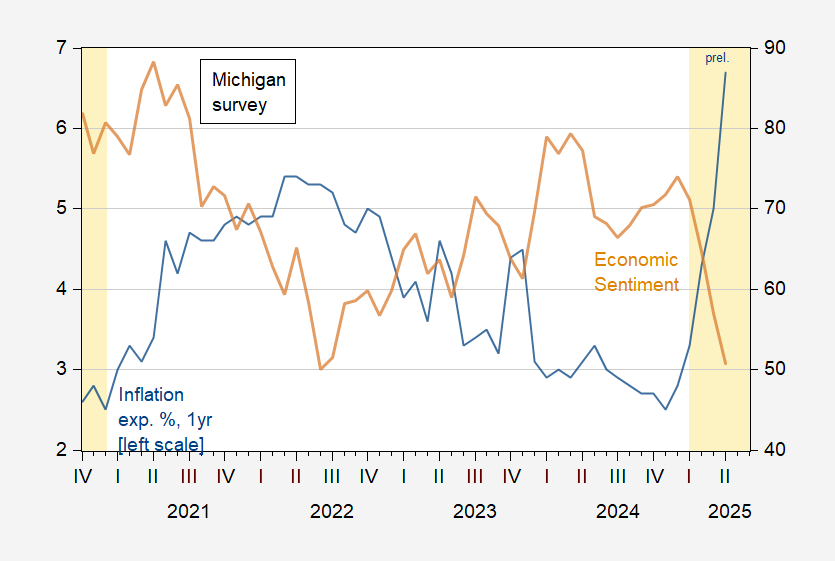
Figure 1: One year inflation expectations, % (blue, left scale), and economic sentiment (tan, right scale). Trump administrations denoted by orange shading. Source: University of Michigan.
The deterioration is concentrated in expectations, rather than in current conditions. Here’s a picture of (preliminary) expectations of future conditions, compared against Conference Board and NY Fed surveys.
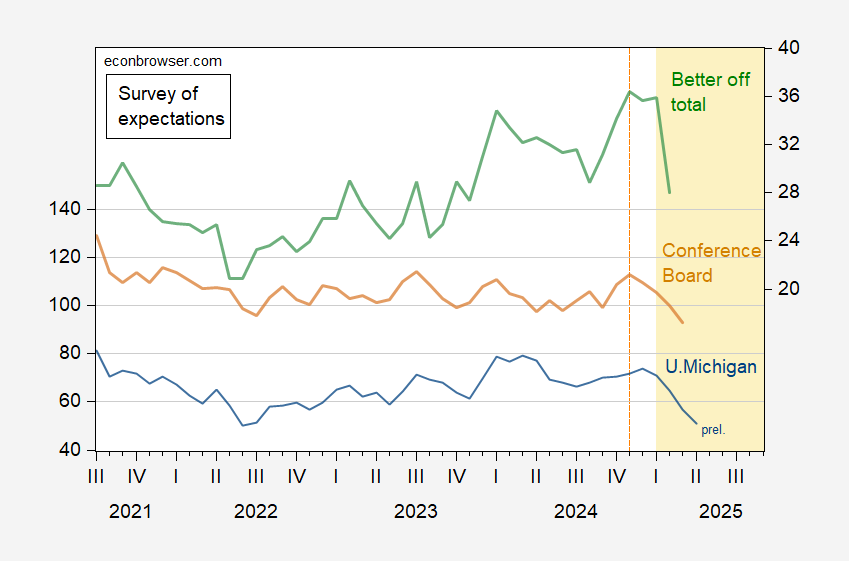
Figure 2: University of Michigan Consumer Expectations (blue, left scale), Conference Board Expectations (tan, left scale), and NY Fed total “better off” in future, % (green, right scale). Source: University of Michigan, Conference Board, NY Fed.