The GDP outlook is down markedly. I was insufficiently pessimistic (relative to WSJ survey respondents) regarding the GDP outlook.
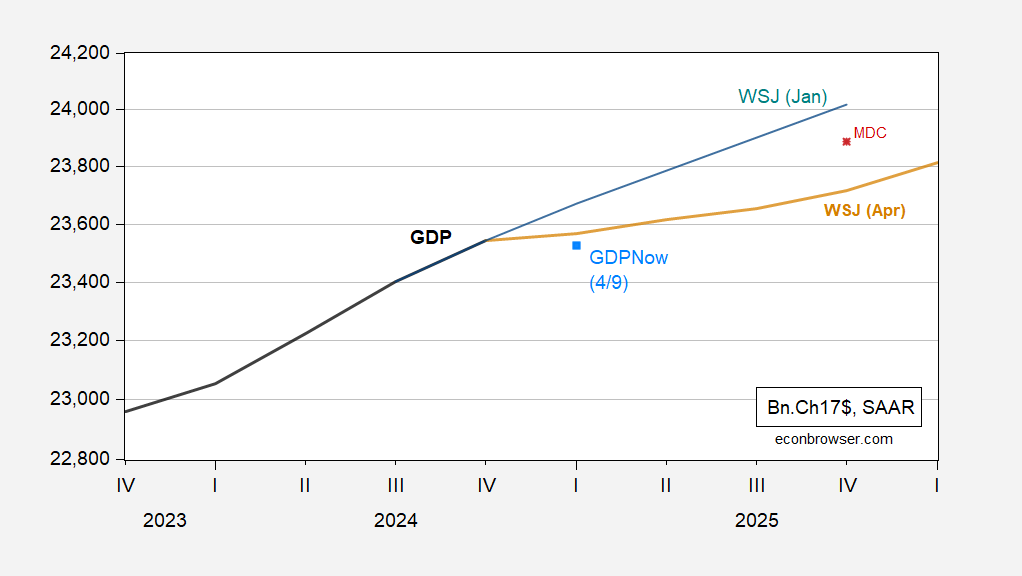
Figure 1: GDP (bold black), WSJ January survey mean (blue), WSJ April survey mean (tan), GDPNow of 4/9 (sky blue square), Chinn forecast for FT-Booth March survey (red square), all in billions Ch.2017$ SAAR. Source: BEA 2024Q4 3rd release, WSJ surveys.
There is a wide range of outcomes predicted for Q3 and Q4, in terms of output levels. While the mean trajectory is positive, the trimmed 20% band includes two quarters of negative growth (Carlton Strong/JP Morgan).
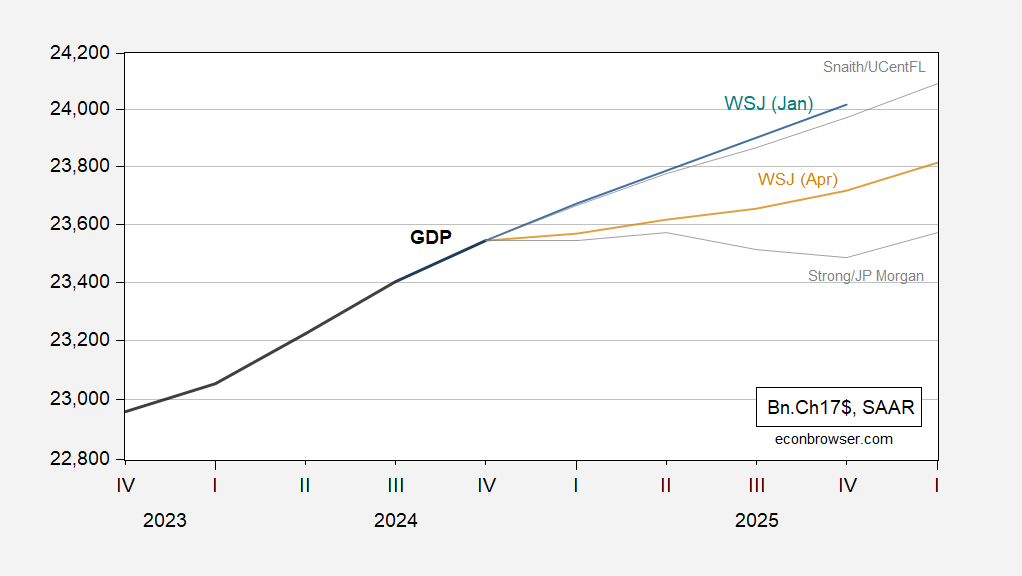
Figure 2: GDP (bold black), WSJ January survey mean (blue), WSJ April survey mean (tan), 20% trimmed high (Sean Snaith/U.Central Florida), low (Carlton Strong/JP Morgan) (gray lines), GDPNow of 4/9 (sky blue square), Chinn forecast for FT-Booth March survey (red square), all in billions Ch.2017$ SAAR. Source: BEA 2024Q4 3rd release, WSJ April survey.
In point of fact, there are 13 respondents predicting two or more quarters of consecutive negative GDP growth. Of course, two consecutive quarters of negative growth does not officially define a recession; rather the NBER’s Business Cycle Dating Committee has greatest claim to defining recessions.
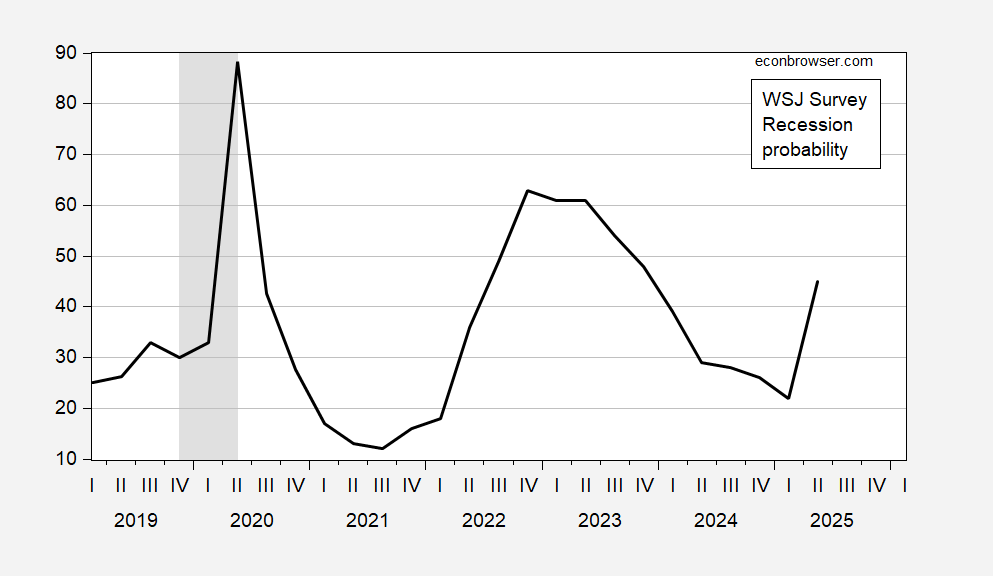
Figure 3: Respondents predicting a recession within the next 12 months, % (black). NBER defined peak-to-trough recession dates shaded gray. Source: WSJ April survey, and NBER.
The number of respondents predicting a recession rose from 22% to 45% in three months. This is the largest 3 month increase recorded, excepting the 2020M04 and 2008M12 readings.
“Of course, two consecutive quarters of negative growth does not officially define a recession; rather the NBER’s Business Cycle Dating Committee has greatest claim to defining recessions.”
Here’s a picture of NBER recessions, Jim Hamilton “recessions” and quarterly changes in real GDP:
https://fred.stlouisfed.org/graph/?g=1Ibbf
Here’s a thing we know – some supply shocks are highly recessionary:
https://econbrowser.com/archives/2011/01/oil_shocks_and_2
Jim Hamilton points out that, as of 2011, nearly all post WWII recessions followed oil market shocks. Hamilton cited the work of Ramey and Vine in observing that supply disruption magnifies the effect of price shocks.
That’s the oil market. Is oil a reasonable analog for other goods? Is Professor Hamilton’s work on oil supply shocks and economic performance relevant for a tariff shock? ‘Cause it sure would be nice to have some guidance right now.
Next question: are we likely to see physical supply interruptions as a result of tariffs? When one orders directly from overseas suppliers, tariffs pretty clearly represent a price shock. If one orders from domestic suppliers – intermediaries – that order supplies from overseas, could one face a supply interruption? Perhaps intermediaries become cautious about holding inventory at the new, higher price. Would such an interruption magnify the impact of the tariff-induced price shock?
We have faced a great deal of politically motivated jiggering of oil markets, and have accumulated a great deal of knowledge about the effect of that jiggering, but we have much less experience of large international supply shocks outside of oil. Covid was a supply interruption that forced prices up, while the Orange Crisis ™ is a price shock which may cause supply interruptions. Is the Covid episode a reasonable guide to the Orange Crisis? How much can we learn from the oil market in assessing the Orange Crisis?