Reader Bruce Hall decries focus on “soft data” (read: it’s all the media’s fault!)
btw, despite the best efforts of the press to claim disaster from Trump’s actions, the stock market has considerably recovered, jobs are up, and inflation is down. Investment is pouring into the US. The border is 95% more secure.
…
And somehow, despite the sky falling, Trump’s approval rating remain pretty good.
Well, why do economists pay attention to “soft data”? Because they’re useful! From Hatzius/GS a couple weeks ago.
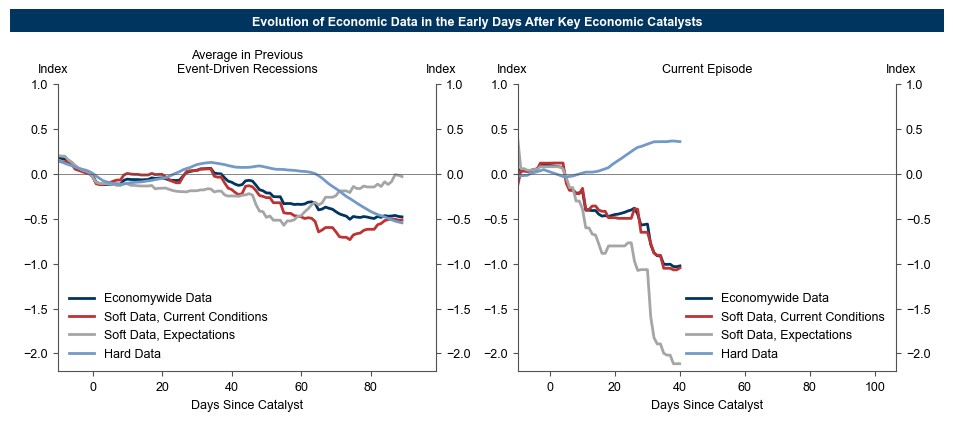
Title: It’s Not Unusual for Hard Data to Lag in Event-Driven Downturns (and Soft Data Have Already Weakened a Lot). Source: Hatzius, “Global Views: On the Precipice,” GS, 6 May 2025.
This suggests we see hard data reflecting a downturn in another three weeks or so.
This pair of graphs is from Abecasis/GS (22 April 2025):
“Event-Driven” Growth Slowdowns in the Economic Data
One salient feature of the current environment is that there is a clear catalyst behind our and other forecasters’ growth downgrades: the drag from higher tariffs and the associated increase in policy uncertainty and tightening in financial conditions. Indeed, we have based our recent forecast adjustments almost exclusively on changes in our expectations for tariff policy.
Now that large tariffs are in effect, how can we expect the economic data to behave? To draw lessons from parallel episodes in US economic history, we zoom into the evolution of the data around a few recessions for which we could identify a relatively clear catalyst that precipitated, accelerated, or worsened the recession.[2] We focus on the 1973 oil spike, the 1979-1980 Volcker interest rate increases, the 1990 oil spike around the invasion of Kuwait, and the 2001 dot-com crash. While these were not the only causes of the downturns, focusing on them allows us to get a rough sense of how long it takes for economically significant shocks to appear in the data.
We summarize the information in our dataset by extracting the first principal components of 1) the overall dataset, 2) the hard data, 3) the current conditions components of the survey data, and 4) the expectations components of the survey data. For this exercise, we have to “back-cast” the indicators that are not available back to the 1970s. When doing so, we simulate the release dates of our back-casted indicators to be at about the same time of the month as their typical release.
These results, …, suggest that the expectations components of the business surveys generally provide a more timely warning of the coming slowdown than the current conditions components shortly after the shock. This is likely because survey respondents can anticipate the effects of the catalyst before they start to see them in their own firms or the broader economy. At the same time, the available hard data typically take about four months to show clear signs of deterioration.
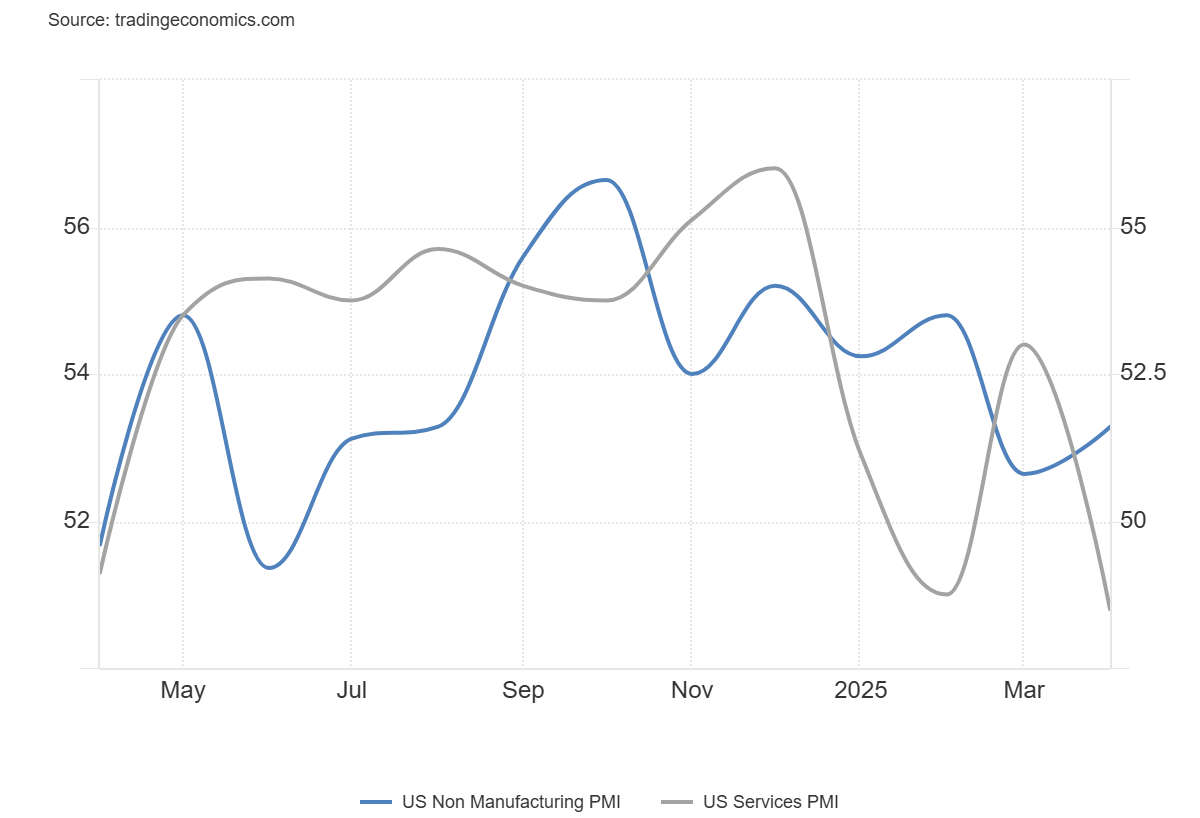
Here’s services PMI:
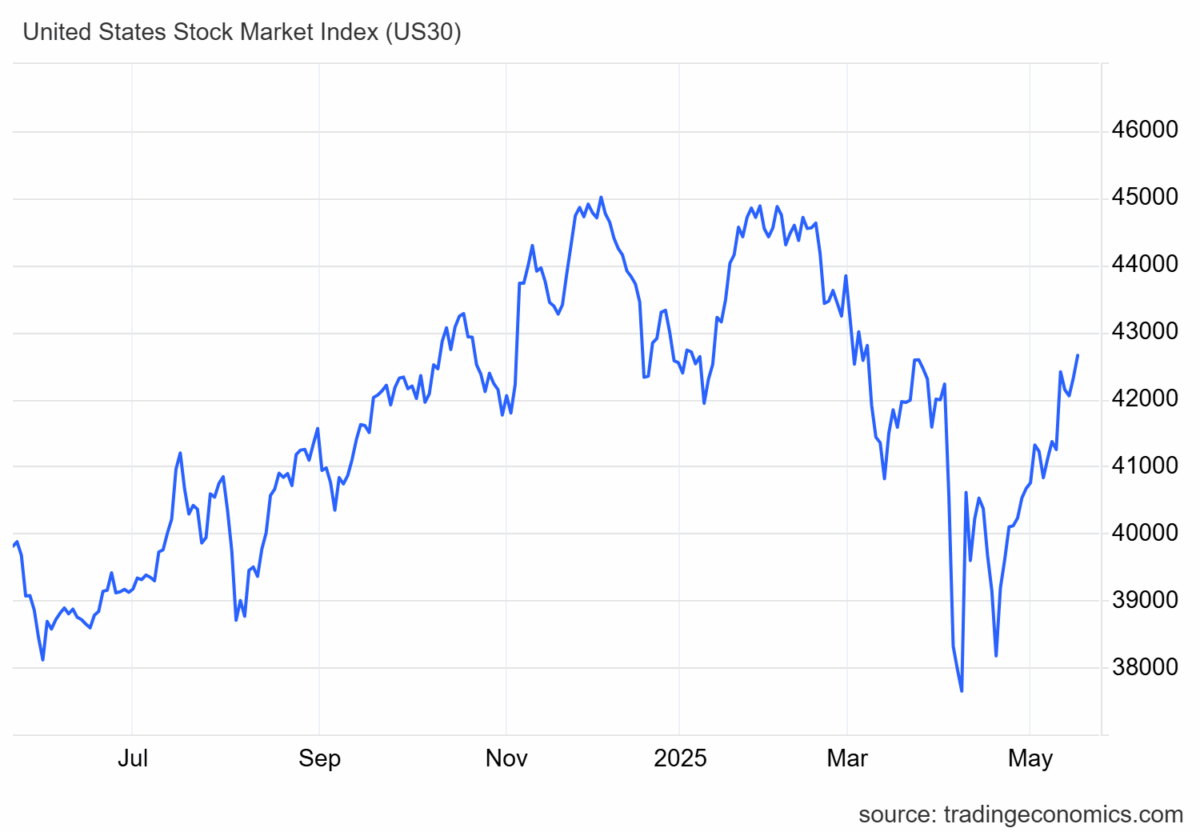
On a side note, large cap and small cap stock indices are down.

“the stock market has considerably recovered, jobs are up, and inflation is down. Investment is pouring into the US. The border is 95% more secure.”
bruce, if that were true, then we can agree that the fed should not be dropping rates, as trump has demanded. we can agree on that, right bruce? bruce, why no response? bruce, are you there? ah that’s right, bruce cannot agree. he thinks it is better to pour gasoline on the fire. which is what you would do if his statement was true. so it makes you wonder how honest of a guy bruce really is with his commentary.
baffled,
fine with me if rates stay up… more income on my cash. I’m with Warren on this one.
https://www.investopedia.com/why-warren-buffett-is-holding-usd325-billion-8772306
Although the S&P500 is down from it’s speculative high, it is still 9.83% higher year-over-year, so the sky is not falling by any means.
https://www.morningstar.com/markets/markets-brief-large-cap-stocks-are-now-overvalued
https://www.morningstar.co.uk/uk/news/260637/us-growth-stocks-look-pricey-and-overbought-are-they-still-investable.aspx
The Fed is concerned about inflation and the consumer tax on imported goods may push that up somewhat, but not sure that we’ll see a repeat of 2021-23.
https://fred.stlouisfed.org/series/FPCPITOTLZGUSA
After all, imports are only about 15% of GDP.
What we are seeing are corrections to the Biden Administration policies that have been very expensive for the US.
https://www.cbp.gov/newsroom/stats/nationwide-encounters
https://budget.house.gov/press-release/cbo-medicaid-spending-on-illegal-aliens-has-cost-taxpayers-over-162-billion-under-open-border-czar-harris (10/24)
https://www.newsweek.com/map-shows-how-much-undocumented-immigrants-cost-each-state-1868673
And while $billions poured into Ukraine…
https://www.scmp.com/news/china/military/article/3311135/us-military-faces-readiness-crisis-modernise-china-advances-pentagon
Sometimes, corrections are necessary… and costly.