With industrial production, we have the following picture of series the NBER Business Cycle Dating Committee focuses on:
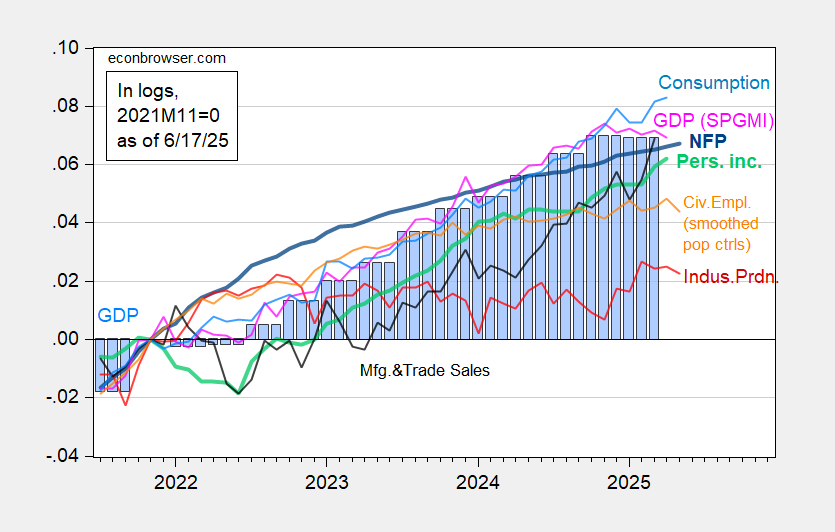
Figure 1: Nonfarm Payroll incl benchmark revision employment from CES (bold blue), civilian employment using smoothed population controls (orange), industrial production (red), personal income excluding current transfers in Ch.2017$ (bold light green), manufacturing and trade sales in Ch.2017$ (black), consumption in Ch.2017$ (light blue), and monthly GDP in Ch.2017$ (pink), GDP (blue bars), all log normalized to 2021M11=0. 2025Q1 GDP is second release. Source: BLS via FRED, Federal Reserve, BEA, S&P Global Market Insights (nee Macroeconomic Advisers, IHS Markit) (6/2/2025 release), and author’s calculations.
Some alternative indicators are shown in Figure 2.
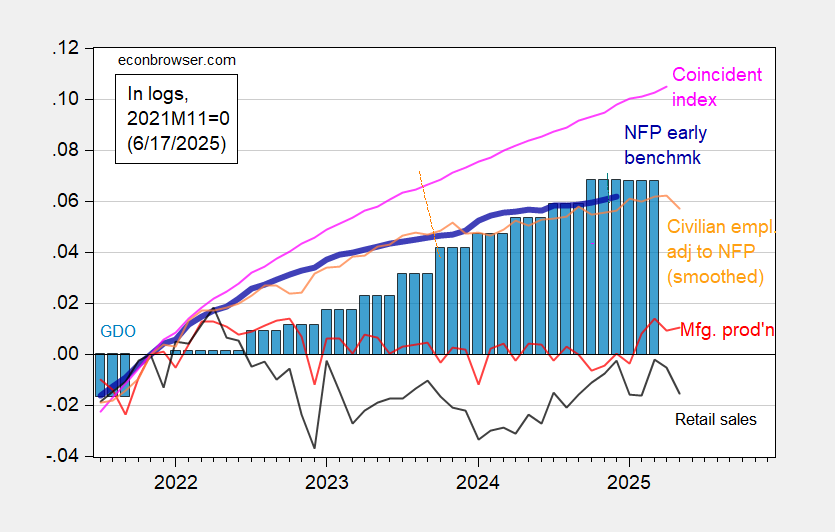
Figure 2: Preliminary Nonfarm Payroll early benchmark (NFP) (bold blue), civilian employment adjusted to NFP concept, with smoothed population controls (orange), manufacturing production (red), real retail sales (black), and coincident index in Ch.2017$ (pink), GDO (blue bars), all log normalized to 2021M11=0. Source: Philadelphia Fed [1], Philadelphia Fed [2], Federal Reserve via FRED, BEA 2025Q1 second release, and author’s calculations.
Manufacturing production was flat, and real retail sales all fell in May.
There’s a new book from CEPR assessing the global economic environment resulting from the second felon-in-chief administration. Here’s a summary:
https://cepr.org/voxeu/columns/economic-consequences-second-trump-administration-preliminary-assessment
There are 50 authors, with Gary Gensler, Simon Johnson, Ugo Panizza and Beatrice Weder di Mauro heading up the effort.
The summary is brief and useful.
Well this is quite something:
https://www.yahoo.com/news/l-dodgers-stand-ice-stunning-210338140.html
The Dodgers told ICE to shove off. No picking up brown-skinned fans from the parking lot ahead of today’s game. Management did this. Current owners include Billie Jean King, Magic Johnson, and a high-profile hodge-podge of sports-involved financiers. The resistance to authoritarian rule extends beyond the street. Great to see.
Off topic – Russia says Russia is on the brink of recession:
https://tass.com/economy/1976033
“Russia’s economy is on the brink of moving to recession, Economic Development Minister Maksim Reshetnikov said…”