With SPGMI’s monthly GDP, we have the following picture of series the NBER Business Cycle Dating Committee focuses on:
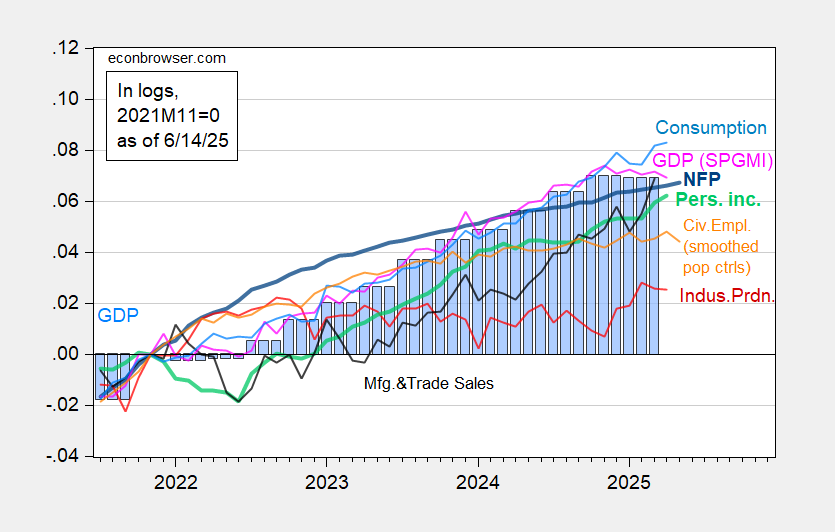
Figure 1: Nonfarm Payroll incl benchmark revision employment from CES (bold blue), civilian employment using smoothed population controls (orange), industrial production (red), personal income excluding current transfers in Ch.2017$ (bold light green), manufacturing and trade sales in Ch.2017$ (black), consumption in Ch.2017$ (light blue), and monthly GDP in Ch.2017$ (pink), GDP (blue bars), all log normalized to 2021M11=0. 2025Q1 GDP is second release. Source: BLS via FRED, Federal Reserve, BEA, S&P Global Market Insights (nee Macroeconomic Advisers, IHS Markit) (6/2/2025 release), and author’s calculations.
Some alternative indicators are shown in Figure 2.
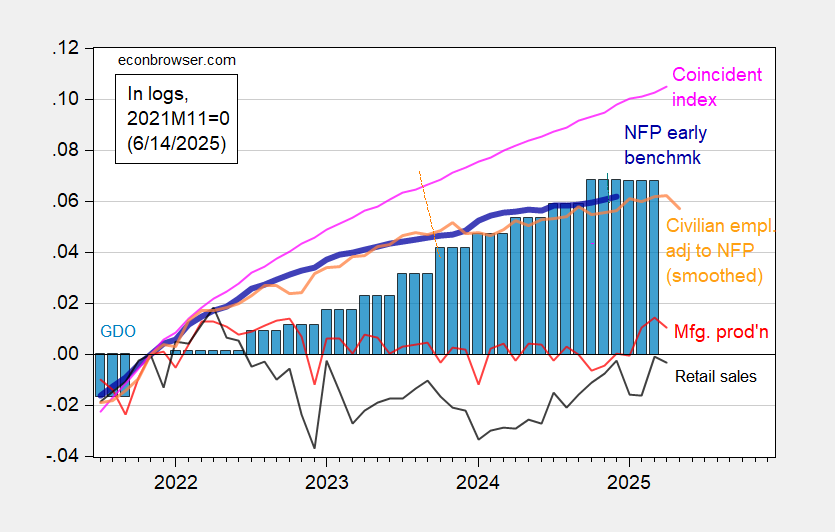
Figure 2: Preliminary Nonfarm Payroll early benchmark (NFP) (bold blue), civilian employment adjusted to NFP concept, with smoothed population controls (orange), manufacturing production (red), real retail sales (black), and coincident index in Ch.2017$ (pink), GDO (blue bars), all log normalized to 2021M11=0. Source: Philadelphia Fed [1], Philadelphia Fed [2], Federal Reserve via FRED, BEA 2025Q1 second release, and author’s calculations.
Monthly GDP, civilian employment, civilian employment adjusted to NFP concept, manufacturing production, and retail sales all fell in latest month available. Given the high levels of sampling uncertainty, I would put little weight on the household survey based series. Nonetheless, there are many series that are “flat-ish”. Consumption rose in April, but at a slowing pace.
Interestingly, the Philly Fed’s coincident index — which is supposed to track GDP — has deviated substantially from monthly GDP (10.4% vs. 6.9%) This is likely due to its reliance on labor market data, which has remained remarkably resilient.
High frequency (weekly) Lewis-Mertens-Stock index has decelerated into early June, as discussed in this post.
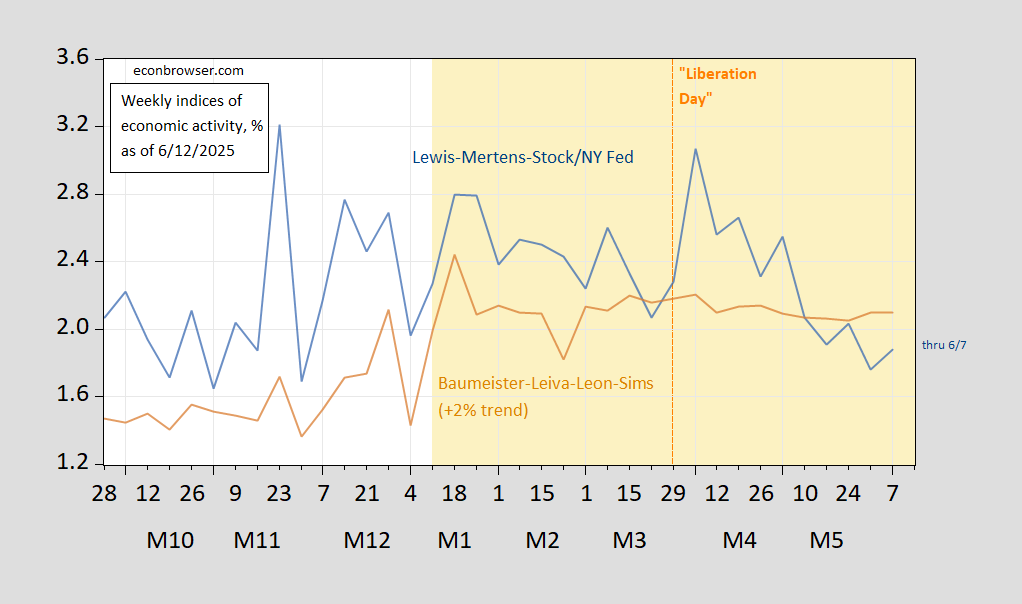
Figure 3: Lewis, Mertens, Stock Weekly Economic Index (blue), and Baumeister, Leiva-Leon, Sims Weekly Economic Conditions Index for US plus 2% trend (tan), all y/y growth rate in %. Source: Dallas Fed via FRED, WECI, accessed 6/12/2025.
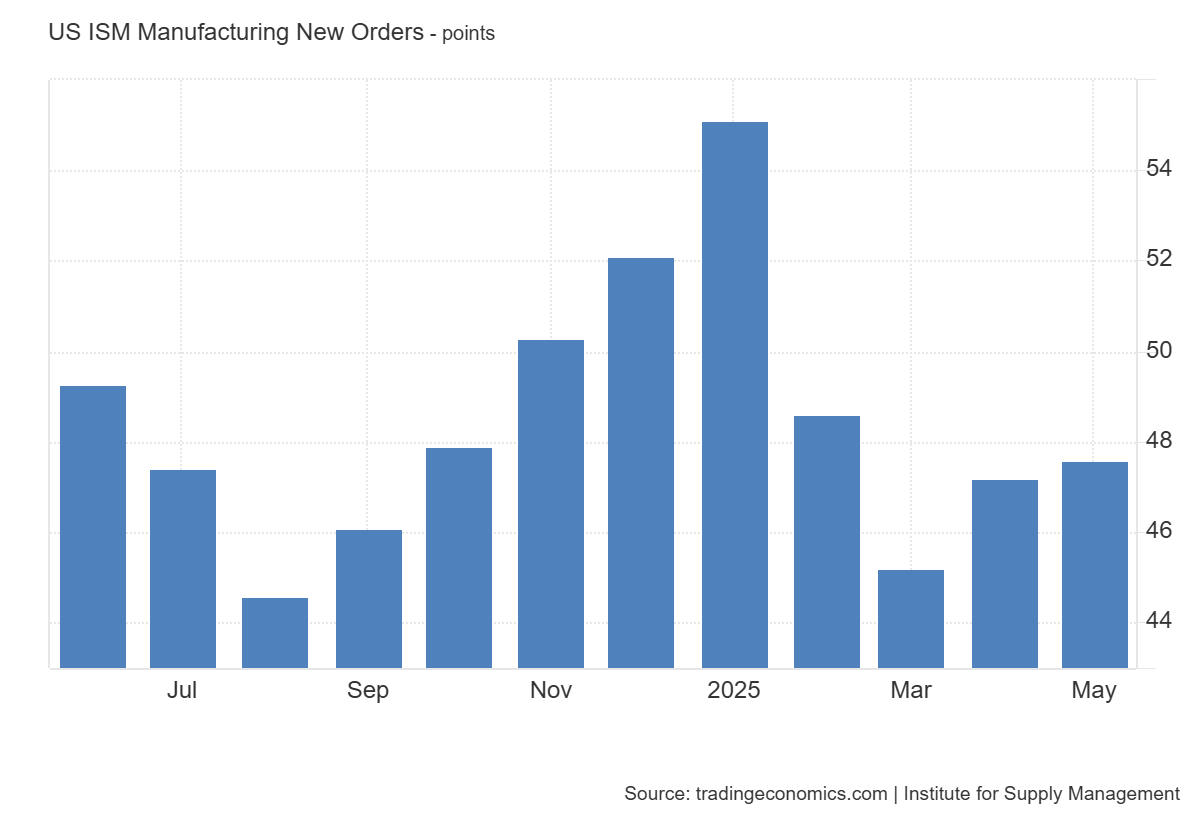
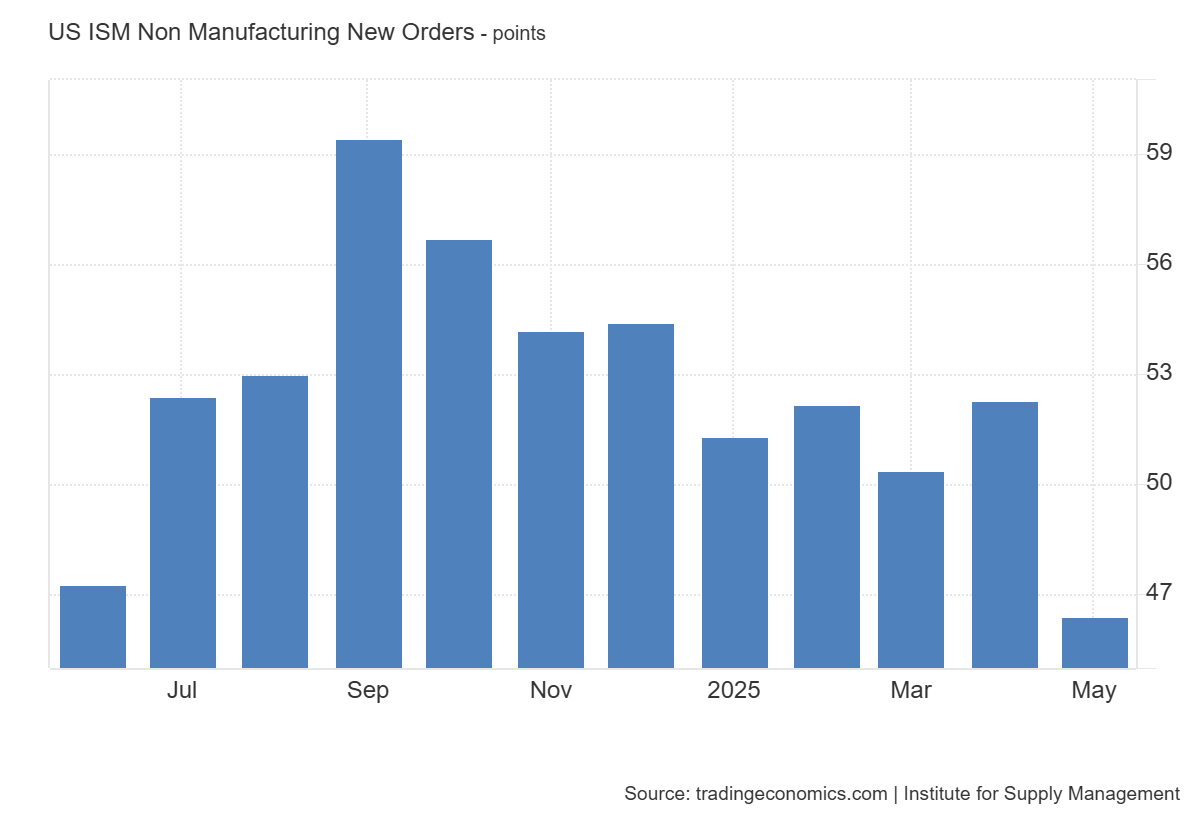
PMI new orders suggest a slowdown as well, with both sectors registering less than 50.
“This is likely due to its reliance on labor market data, which has remained remarkably resilient.”
Well that depends on what labor data you look at. As I noted in the prior comments section, unemployment is looking pretty scary right now – recessionary scary. I’ve seen commentary suggesting that deterioration in household credit data shouldn’t cause concern because household incomes are doing so well. The aggregate income series looks like this:
https://fred.stlouisfed.org/graph/?g=1JBWN
Not great, and clearly not leading, but still positive. However, here’s the payroll index, adjusted for inflation, looking far less…middling good:
https://fred.stlouisfed.org/graph/?g=1JBWy
The payroll index measures weekly income for hourly workers, accounting for both hours worked and wages. The gain in Q1 was just 0.8%, annualized. That’s the weakest gain since Q1, 2011. Seems like, when we look at paychecks at the broad lower end of the spectrum, there’s evidence of real softening. That softening is coincident with the felon-in-chief’s tariff scare. And we haven’t seen the full effect of tariffs, nor harassment of immigrants, nor threats to tax foreign investment.