Policy uncertainty has remains high; does it matter for economic uncertainty?
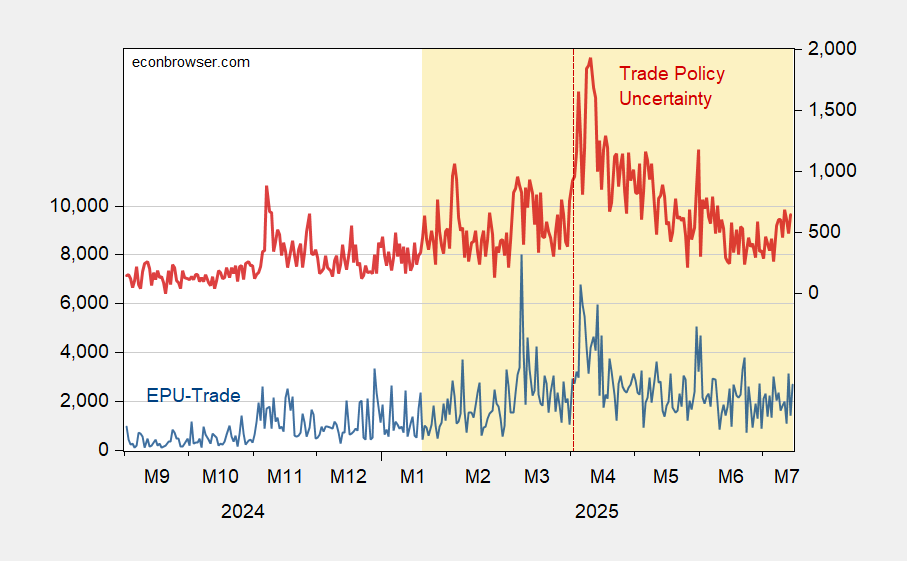
Figure 1: EPU-trade category (blue, left scale), and Trade Policy Uncertainty index (red, right scale). Source: Baker, Bloom & Davis policyuncertainty.com, and Caldara et al. TPUD.
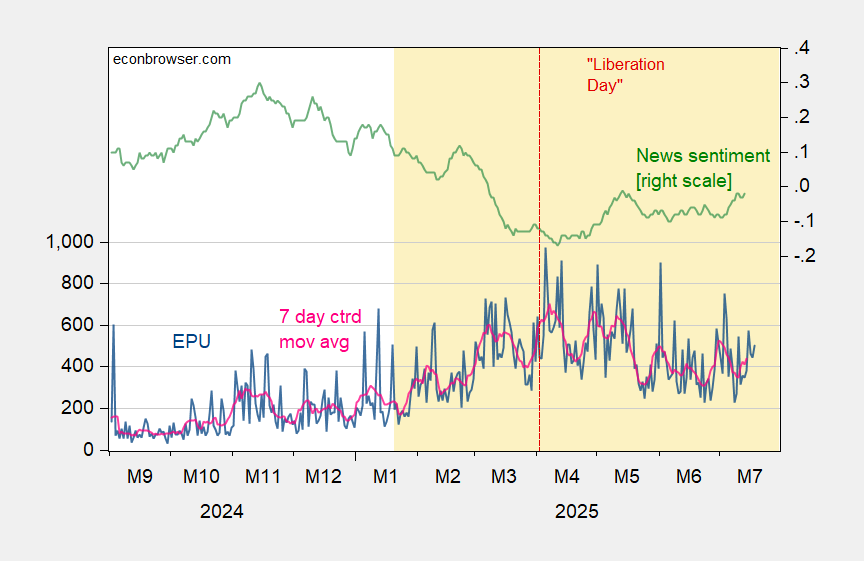
Figure 2: EPU (blue, left scale), and centered 7 day moving average (red, right scale), SF Fed News Sentiment index (green). Source: policyuncertainty.com, SF Fed, and author’s calculations.
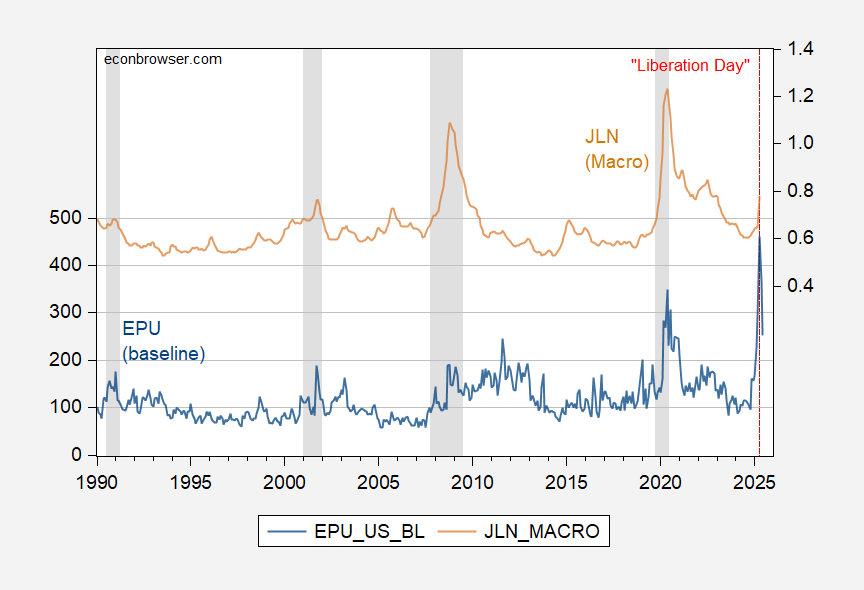
Figure 3: EPU (legacy) (blue, left scale), Jurado, Ludvigson, Ng (JLN) macro uncertainty index (tan, right scale). NBER defined peak to trough recession dates shaded gray. Source: policyuncertainty.com, Ludvigson, and NBER.
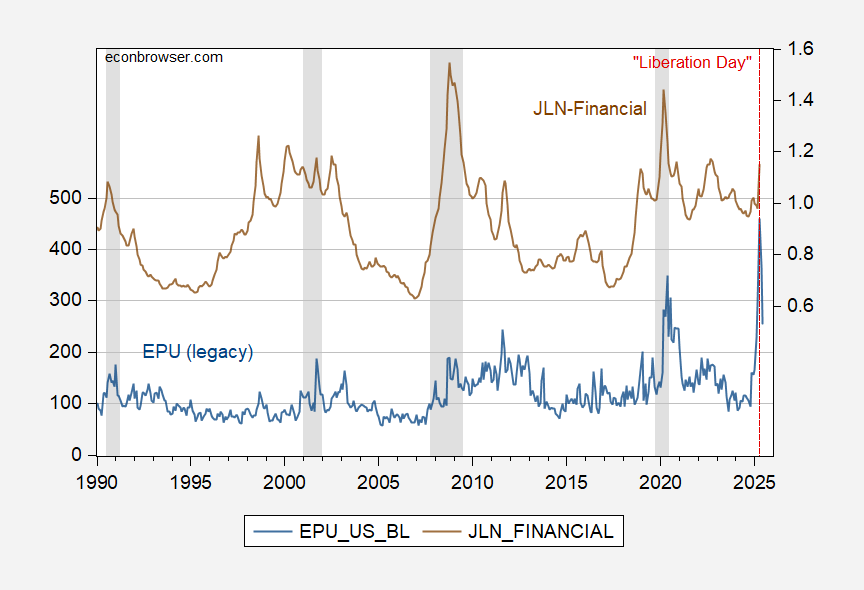
Figure 4: EPU (legacy) (blue, left scale), Jurado, Ludvigson, Ng (JLN) financial uncertainty index (tan, right scale). NBER defined peak to trough recession dates shaded gray. Source: policyuncertainty.com, Ludvigson, and NBER.
In a bivariate setting, one rejects the null hypothesis that JLN Granger causes EPU, but one can not reject the null hypothesis that EPU causes JLN, at conventional levels.
As of April (the last available observation), the JLN-macro series was over one standard deviation above the mean. And JLN (AEJ-Macro, 2021) suggests that financial uncertainty is an exogenous determinant of the business cycle activity.
Too late to do any good:
https://www.newsweek.com/heritage-foundation-founder-edwin-feulner-dead-83-2101101