From Orrenius et al. (2025), GDP growth is down 0.81% in 2026, 0.49% in 2027.
These estimates based on a VAR(2) using annual data, net unauthorized immigration as a percent of the previous-year U.S. population, annual growth rate of nonfarm payroll employment, the PCE annual inflation rate, and yearly GDP growth.
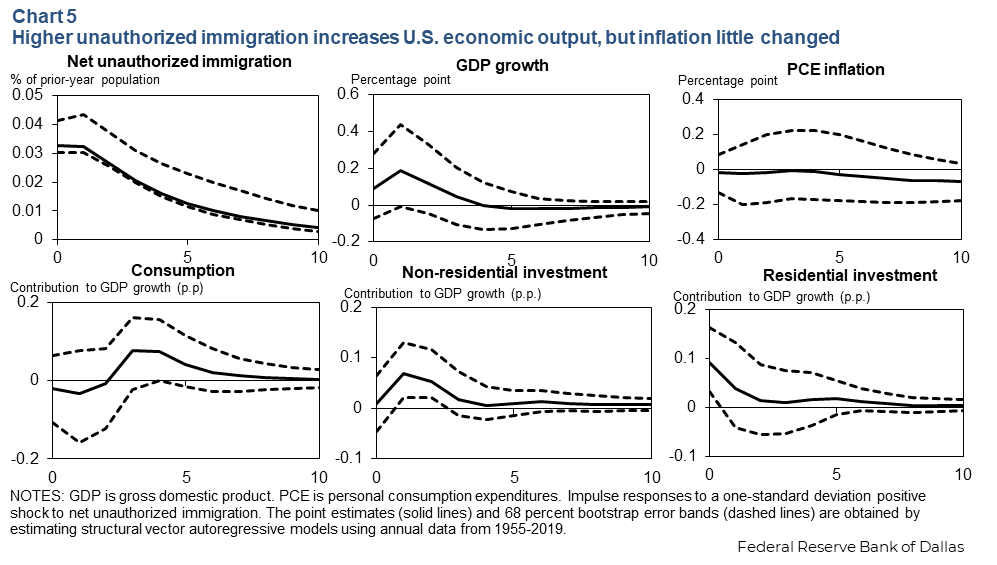
Source: Orrenius et al. (2025).
PCE inflation is 15 bps and 6 bps higher in 2026 and 2027 under baseline.
It’s interesting that the attributed positive effect on GDP from illegal immigration coincided with an economic rebound of pent-up domestic demand from the COVID shutdowns. I wonder how that was separated in the analysis. The old saying that correlation is not necessarily causation survives for a reason. Other voices say differently with regard to the net effect of illegal immigration.
https://budget.house.gov/imo/media/doc/the_cost_of_illegal_immigration_to_taxpayers.pdf
I accept that there may be different viewpoints and data used when attempting to estimate either the positive or negative impact of illegal immigration. Golf courses and slaughter houses love compliant, low-paid workers. Poor Americans might not like the competition for subsidized, low-income housing.
https://www.axios.com/2023/09/23/housing-crisis-migrant-immigrants-homeless
Bruce Hall It’s interesting that the attributed positive effect on GDP from illegal immigration coincided with an economic rebound of pent-up domestic demand from the COVID shutdowns
The authors used data going back to the 1950s, so the relationship is not just COVID rebound effects.
The old saying that correlation is not necessarily causation survives for a reason.
The authors used a structural VAR, so your comment really doesn’t apply.
I accept that there may be different viewpoints
The House budget stuff is garbage economics. Virtually every intellectually respectable study finds that immigration increases GDP. FYI, the non-partisan CBO found that immigrants increase GDP. The House budget “analysis” is just intended to provide people who don’t have a deep understanding of economics a kind of fig leaf to hide behind…as though there’s some kind of equivalence between MAGA economics and actual economics.
What you said.
Brucie has Dunning-Krugered himself again.
Bruce Hall Your link on the cost of illegal immigration is shot through with errors. This Bozo has it completely wrong regarding the net cost of immigrants. According to CBO https://www.cbo.gov/publication/60569#_idTextAnchor019
In its analysis of the effects of the surge, CBO considered the effects on the budget stemming from taxes paid and benefits received by the surge population and their U.S.-born children as well as the budgetary effects of the changes in the economy caused by the surge.
The largest effects on the federal budget stem from individual income and payroll taxes paid by immigrants. In CBO’s baseline projections, the people in the surge population pay $788 billion in taxes over the 2024–2034 period. The participation of those immigrants and their children in federal programs adds $177 billion to mandatory spending over the period.
As to the overall effect on GDP:
Some of the projected budgetary effects of the immigration surge stem from broader changes in the economy that the surge is expected to bring about. In CBO’s projections, the surge boosts total nominal gross domestic product (GDP) by $1.3 trillion (or 3.2 percent) in 2034 and by $8.9 trillion over the 2024–2034 period. The surge increases the total amount of wages paid each year by a percentage that grows steadily over that period and reaches about 3 percent in 2034. Those additional wages are a major contributor to the boost in revenues because they are subject to both payroll and income taxes. In addition, two main factors resulting from the surge—faster growth of the labor force and greater demand for residential investment—boost the rate of return on capital and put upward pressure on interest rates. The increases in interest rates are a major contributor to the boost in federal spending.
And keep in mind, these numbers only refer to those immigrants who entered the country during the “surge.” Immigrants who have lived here for many years add even more to GDP.
You really need to find some better (i.e., less clearly racist) sources. And your source isn’t even an economist, so he really should shut up about macroeconomics.
U.S. economic and weather data is going to be much more difficult to find or nonexistent under the Trump admin. One example – the Trump admin stopped collecting the economic impact from flooding – some estimates from recent Texas flooding is that it caused $15-22 billion in damages. https://www.bloomberg.com/news/articles/2025-07-10/trump-s-cuts-to-federal-government-are-making-data-disappear
Hmmm.
If I take the Orrenius data (tab Data 4), and I add up the annual net unauthorized immigration, we come out with just under 60 million in total through 2019. No estimate, even the most virulent ones, comes anywhere close to this. Through 2019, PEW Research, generally considered the gold standard of unauthorized population estimates, puts the total around 10-11 million, with really high right wing estimates around 22 million.
Further, I have no clue why Orrenius stops the data at 2019, given that we have monthlies to date, I believe.
I may have to spend more time on the matter. But there is a notably missing graph above, and that’s the unauthorized immigrant share and absolute numbers of the labor force. That should be graph 2, where the GDP growth graph sits now.
Perhaps if you’d read the study:
“We choose 2019 as the end of our estimation sample to avoid including the pandemic years.”
If the authors do math based on public sources, and then you do some math you don’t show us and come up with a number you don’t find credible, perhaps you should check your own math before questioning theirs. For instance, you seem to have assumed that no immigrants have died since 1956? We’d better stick with the authors numbers.
The horizontal axis is years or months? Or?
mike: years.