So the sector overall looks like it’s in the doldrums:
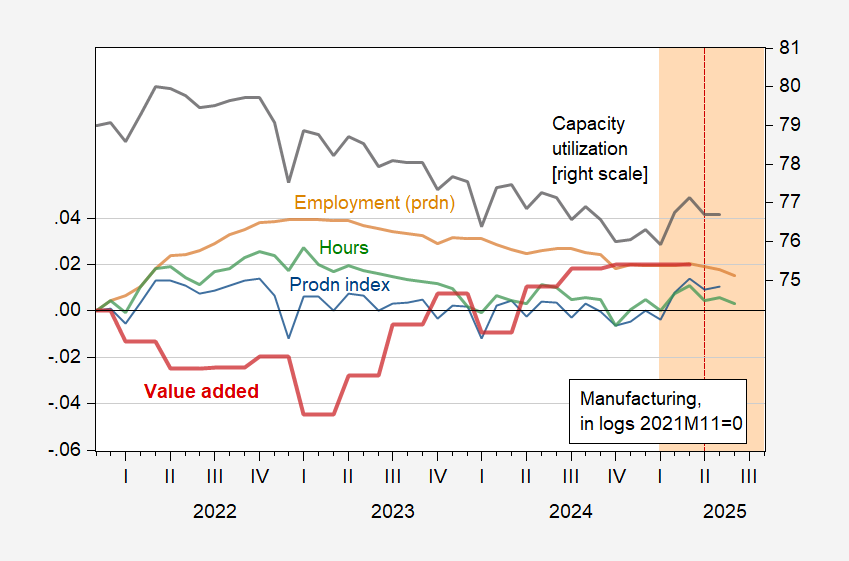
Figure 1: Manufacturing production (blue), value added in 2017$ (red), employment (production and nonsupervisory) (tan), hours (light green) all in logs, 2024M04=0; and capacity utilization (NAICS), % (black, right scale). Aggregate hours of production workers calculated by multiplying average weekly hours by employees. Dashed red line at “Liberation Day”. Source: Federal Reserve, BEA, BLS, and author’s calculations.
Manufacturing ISM PMI (new orders) still down:
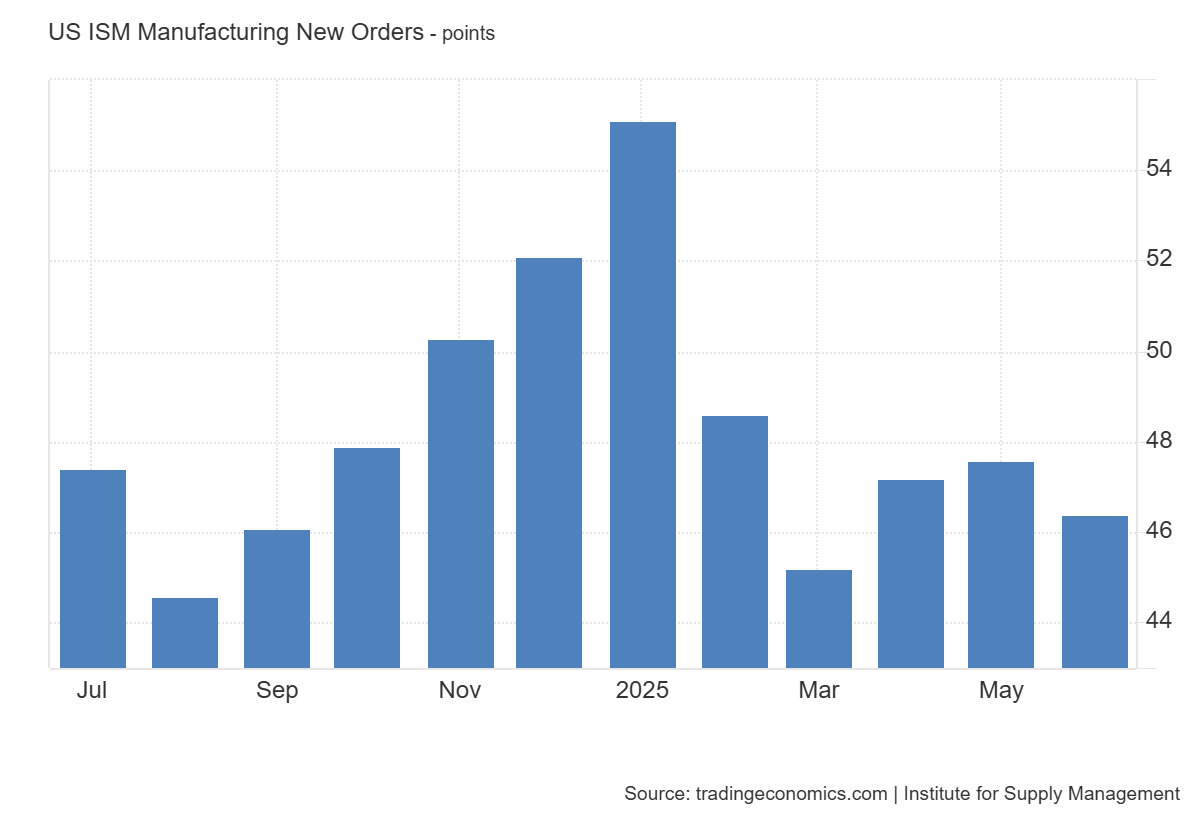
Source: TradingEconomics.com accessed 7/5.
EJ Antoni notes the slide in manufacturing employment, but pins his hopes on trade “deals”, to wit:
Slide in manufacturing jobs continued in Jun, in line w/ survey data from PMIs, regional Fed banks, and others; if trade deals can be reached soon, this will likely reverse; remember that more than half of what we import in the U.S. are inputs that will eventually be exported.
With two “deals” (more like a memoranda of understanding) set, still about 88 to go by Wednesday, or…
Manufacturing productivity has failed to increase since 2011:
https://fred.stlouisfed.org/graph/?g=m2mB
January 30, 2018
Manufacturing Productivity, * 1988-2025
* Output per hour of all persons
(Indexed to 1988)
Well, correctly stated, manufacturing productivity is lower than it was in 2011. It has increased many times, decreased others.
Autor, Dorn, Katz, Patterson and Van Reenen find evidence that industry concentration weakens productivity growth in general, while pushing output growth toward firms with a low labor share:
https://academic.oup.com/qje/article-abstract/135/2/645/5721266
Weak anti-trust enforcement is thus a likely culprit in the stall in productivity growth, and along the way the failure of labor’s share of income to keep up with labor productivity.
https://fred.stlouisfed.org/graph/?g=mvkl
January 30, 2018
Real Manufacturing Production and Manufacturing Productivity, * 1988-2025
* Output per hour of all persons
(Indexed to 1988)