There’s a view that civilian employment (household series) peaks before nonfarm payroll employment (establishment series). If true, then time to worry.

Figure 1: Civilian employment over age 16 (blue), nonfarm payroll employment (tan), private nonfarm payroll employment (red), private nonfarm payroll employment from ADP (red), all in logs 2025M04=0, seasonally adjusted. Civilian employment is experimental series using smoothed population controls to 2024M12. Source: BLS, ADP via FRED, BLS, NBER.
Civilian employment has a peak at April 2025, even as NFP (total, private) have continued to rise. ADP private NFP decreased in June.
In truth, out of the last four recessions, the household series peaks before establishment only twice, as discussed in this post. Below are the (real-time) depictions of the household and establishment series around recession dates for the previous four recessions.
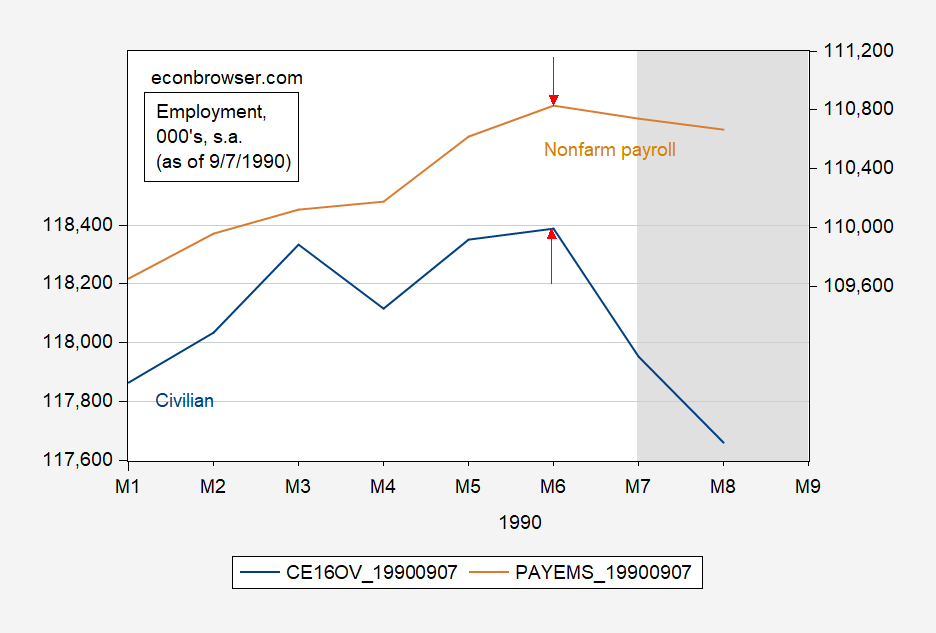
Figure 2: Civilian employment over age 16 (blue, left log scale), nonfarm payroll employment (tan, right log scale), both in 1000’s, seasonally adjusted, both as of 6/7/1990. NBER defined peak-to-trough recession dates shaded gray. Source: BLS via ALFRED, NBER.
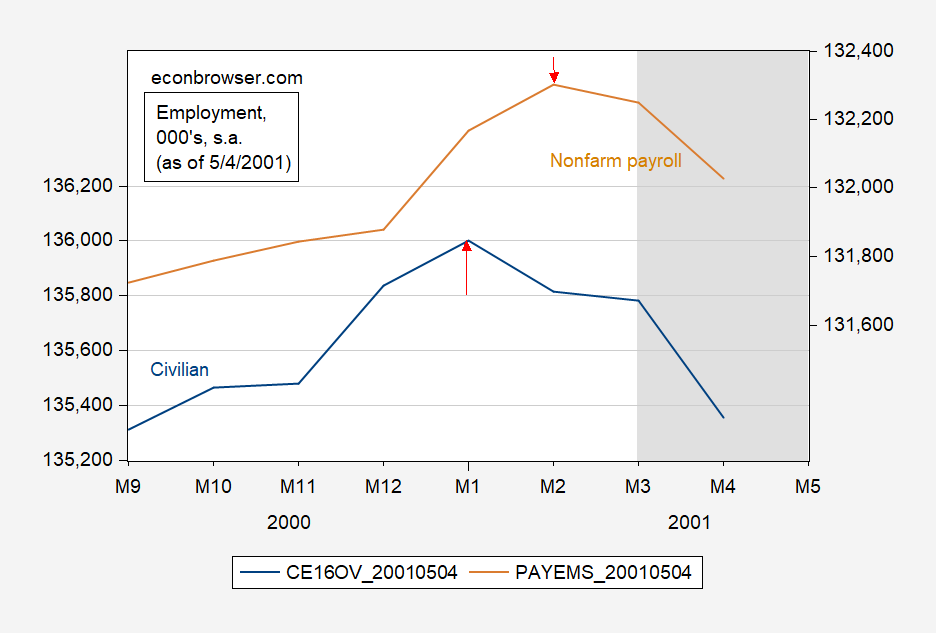
Figure 3: Civilian employment over age 16 (blue, left log scale), nonfarm payroll employment (tan, right log scale), both in 1000’s, seasonally adjusted, both as of 5/4/2001. NBER defined peak-to-trough recession dates shaded gray. Source: BLS via ALFRED, NBER.
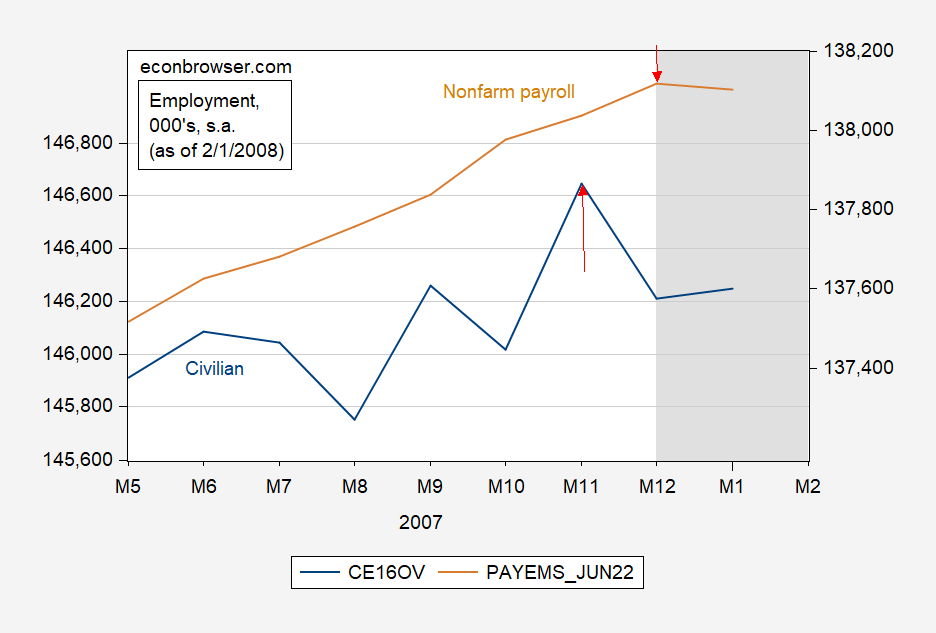
Figure 4: Civilian employment over age 16 (blue, left log scale), nonfarm payroll employment (tan, right log scale), both in 1000’s, seasonally adjusted, both as of 2/1/2008. NBER defined peak-to-trough recession dates shaded gray. Source: BLS via ALFRED, NBER.
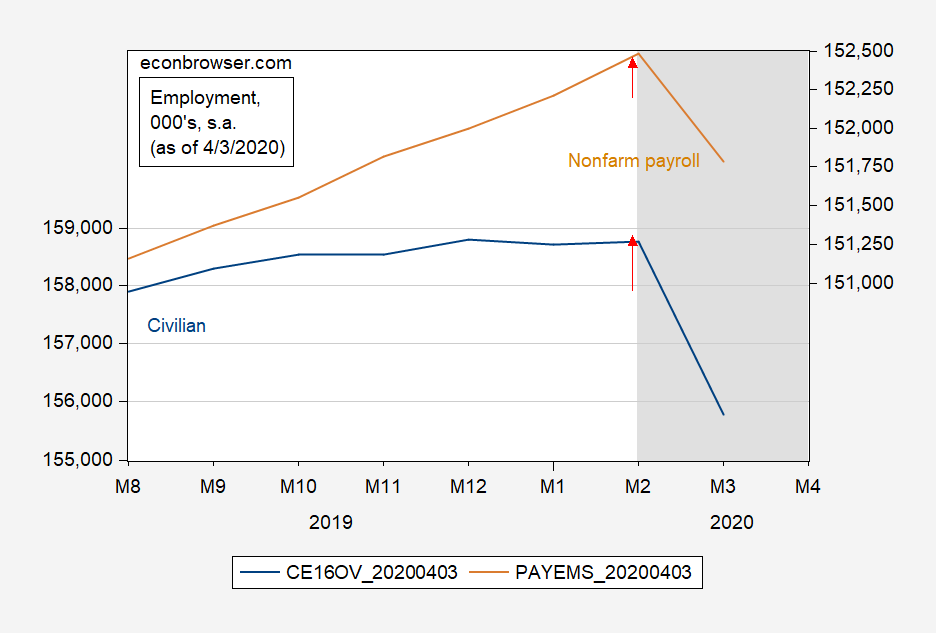
Figure 5: Civilian employment over age 16 (blue, left log scale), nonfarm payroll employment (tan, right log scale), both in 1000’s, seasonally adjusted, both as of 4/3/2020. NBER defined peak-to-trough recession dates shaded gray. Source: BLS via ALFRED, NBER.
In real time, the household series turns one month earlier than the establishment in two cases (2001, 2007), and twice the turning points are the same time (1990 and 2020). In the revisions, the civilian series peaks are moved earlier once (1990), and later by two months (2001). The NFP peak is moved later once (2001 recession).
Middling argumentation. For example, 2020 is not a good template. That’s a suppression, not a recession. You’re talking now about a recession, or conceivably a different kind of suppression (tariffs, round up of illegals, etc.)
I think I would be looking more at initial unemployment claims. These are creeping up a bit, but still at historically low levels. If UIC rose above, say, 300,000 — certainly 350,000 — then I would be concerned. But right now, I don’t think the numbers are sufficient to call the beginning of a recession. At least not employment levels.
Of course, that doesn’t mean no recession. I just don’t think the numbers are compelling at this point.
Steven Kopits: Discounting 2020 strengthens the case for civilian employment precedence (now 2/3 of the last three recessions).
It is simply remarkable that you, the guy who recently tried to argue that there is some natural limit to tax revenue as a share of GDP around 20% (or less), and who is here arguing from the made up idea of “suppression”, is qualified to criticize other peoples’ arguments.
Leave economics to those who have some respect for the science.
I think single family home inventory levels could be an interesting indicator. The graph below suggests that inventories could reach pre-covid levels sometime in H2 2025. If so, modest downward pressures could manifest is much steeper declines as home prices normalize, and that could mean a recession, or frankly, being consistent with a depression.
https://blogger.googleusercontent.com/img/b/R29vZ2xl/AVvXsEgIaU6thZnjd5_G1tnh70nbjZlMclFMVvzZ-AnExV3oTSs5EvVqKTMXt6UVTK4YigvUmXXGYQvS8HR58KkjsxPtLvKg7rITw-PEBeL0wtj9XJX_e7yw8oYJjbMByKe6kt6M5jWe6clrOLR3eL86ADx92cqq2AomjlxzHYazpOyG8zy4P61l2MPo/s1084/AltosYoYJuly72025.PNG
The Conference Board calculates an Employment Trends Index of 8 leading employment indicators. It has a pretty good record of leading turns in payroll employment. The text is a bit too “this was up and this was down” to be useful, but scroll down to the figure comparing the Board’s index to payrolls and you get the story:
https://www.conference-board.org/topics/employment-trends-index
The ETI turned south quite some time ago. Assuming no big structural changes in the labor market, that’s a pretty good reason to worry about hiring in the near term. Note that weakness in the ETI began before the felon-in-chief’s policies were imposed, so damage from them adds to the risk to employment.
In addition, the ISM factory employment index fell to 45 in June, services employment index at 47.2 in June – both pointing to somewhat weak labor market conditions.
Some interesting insights from Royal Bank of Canada,
Most people out of work force don’t want a job.
https://www.rbc.com/en/thought-leadership/economics/featured-insights/america-needs-workers-not-jobs/
Perhaps that should be studied more… not for explanations, but for the causes. In one study concluded:
“Many jobs are simply not satisfying,” Vissing said. “Working for others who get the benefit of our physical labor and intellectual property is not rewarding either emotionally or financially. People want to work doing jobs that matter to us. We want to use our creativity. We want to matter, and in many businesses, employees simply don’t get treated with the respect and support that we need and want. People walk away from them.”
Is that too much whining for you? Should be.
https://www.newsweek.com/american-men-dont-want-work-anymore-1897567
Maybe they walk away because our country has made it too easy to not work. So, we “need” illegal aliens to do the work because the takers find it so unpleasant to have to be a maker.
OK, first, let’s recognize that Stevie is not really talking about economics here. He’s whining about whining. Other people aren’t behaving the way he thinks they should, and he’s pretending moral superiority and then whining. The guys a “consultant” who courts faux news. Of course he’s whining.
If people – men – are working less than at some prior time, that’s their choice. Isn’t that what living in a free country (if we can keep it) means? Making our own choices? Apparently, for Stevie, that’s true for the rich but not the rest. Notice Stevie is engaging in “makers vs takers” class warfare. That whole deal is about one class twlli g all others how to behave, at all times, in all places.
In a market economy, bringing workers off the sidelines requires increasing compensation. Not paternalistic moralizing. Not name-calling. If the compensation required is better work, then offer better work or do without. And stop whining.
Now, about the RBC piece – not their best work.
“…this isn’t because the US economy is booming. Instead, the low unemployment rate represents the shortage of available labor, not a demand for workers.”
Timing is important in evaluating this claim. Until recently, net hiring in this cycle ran well ahead of the historic average:
https://fred.stlouisfed.org/graph/?g=1KdJj
Stronger than normal hiring doesn’t fit with “not booming”. Demand for workers is a necessary element in hiring,and hiring in this expansion has been very strong. The numbers, as they say, don’t lie.
More recently, hiring has slowed, and explanations for that slowing vary. NABE members, in their latest survey responses, are worried about recession:
“The probability of a U.S. recession has shifted notably higher since the January survey. Seventy-five percent of panelists put the probability of a recession at more than 25%. In the January survey, 15% of panelists put the probability at more than 25%.”
https://nabe.com/NABE/Surveys/Business_Conditions_Surveys/May-2025-Business-Conditions-Survey-Summary.aspx
Press reports speculate that AI is cutting into hiring, but so far only about 6% of firms report adopting AI. Coding is the only job that is obviously suffering from displacement by droids. There is also speculation that a shortage of immigrant labor is slowing hiring. That seems quite possible:
https://fred.stlouisfed.org/graph/?g=1KdLZ
Anyhow, RBC has conflated a story about the future, when the old-age dependency ratio will be higher, with recent performance. That’s a simple problem of bad logic, of poor writing. We really don’t need to worry about economics when the problem is logic.
But there’s more…
Demographics do matter, and the U.S. old-age dependency ratio is climbing. A future rise in the dependency ratio leads RBC to claim that spending of retirement money assures strong growth. Along with being contrary to conventional thinking about dependency ratios, that just seems simplistic. If ya stare at an AD vs AS graph, you see the possibility that retirement money will drive inflation instead of real consumption: AD up/AS down => higher prices, not higher output. This is no longer a logic problem. This is just sloppy economics by the “thought leadership” guys at RBC. Those familiar with “thought leadership” will not be surprised.
So anyhow, Stevie has whined about people – working-age men – not doing what he wants them to do and has linked to a stinker of a “thought leadership” piece from RBC. Nice going, Stevie.
Downward revisions to employment since 2023 have been pretty stark. 26 weeks unemployed index hit a new high, growth only seen during recessions. Its at the same level as January 1994. One of my favorite indexes as it confirms the smoke decay in the economy since 1969.
I expect NFP only added 130,000 jobs a month on average in 2024.
Considering bruce hall spent a lifetime getting paid in spite of any tangible value, i find it gross that he would complain about others work ethic. Bruce would be unable to maintain employment in todays world. He lived off the largess of the baby boom, where demographics protected quite a few unsophisticated workers.