Durables consumption has experienced extreme volatility over the last 9 months (since the election). However, services and nondurables should follow the permanent income hypothesis — at least halfway (DSGE’s usually incorporate about 50% hand-to-mouth consumers). So what do we see?
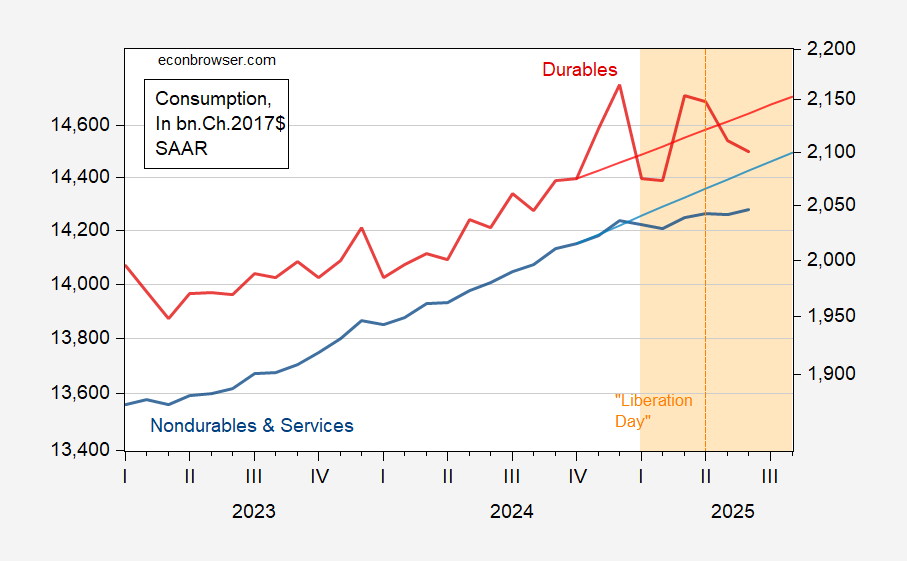
Figure 1: Sum of nondurables and services consumption (blue, left log scale), 2023M11-2024M10 stochastic trend (light blue line, left scale),durables consumption (red, right log scale), 2023M11-2024M10 stochastic trend (light red, right scale), all in bn.Ch.2017$ SAAR. Orange shading denotes Trump 2.0 administration; orange dashed line at 2025M04. Source: BEA, July release, and author’s calculations.
The gap between services consumption and trend is even larger. To the extent that services consumption is driven by the permanent income hypothesis (even if up to half of consumers are hand-to-mouth), this means there’s been downshift in perceived future stream of income.
I appreciate your graph, but I assure you that the impact on daily life is perceptible without the effort. 🙂
Economist Dean Baker is always complaining about the news media failing to put budget numbers in context. For example they will say that the budget for public broadcasting is $500 million per year which sounds like a big number, but in context it is 0.008% of the budget, or $1.60 per person per year.
We should apply the same rule to Trump’s proposed 90,000 square foot ballroom at the White House, reported by the media. Do readers have any idea what 90,000 square feet means?
The White House residence has a footprint of about 15,000 square feet. In context, that means that Trump’s new ballroom building will be 6 times the size of the White House!
Why doesn’t the media report this? They are lazy and failing in their jobs to actually inform the public when they just post numbers without context.
By the way, does Trump really have the unilateral authority to modify public property to this extent even if he claims it will be financed by donations (which are another word for bribes)? Or course, who’s to stop him? Certainly not the Republican congress.
Services consumption inhibited by tariffs? There’s a great classroom example of the income effect. Real-world example, too, of course.