Maybe, maybe not. With the employment release of Friday, here’re the pictures, first of NBER’s BCDC key indicators, and second of alternative indicators (recalling all the most recent data will be revised):
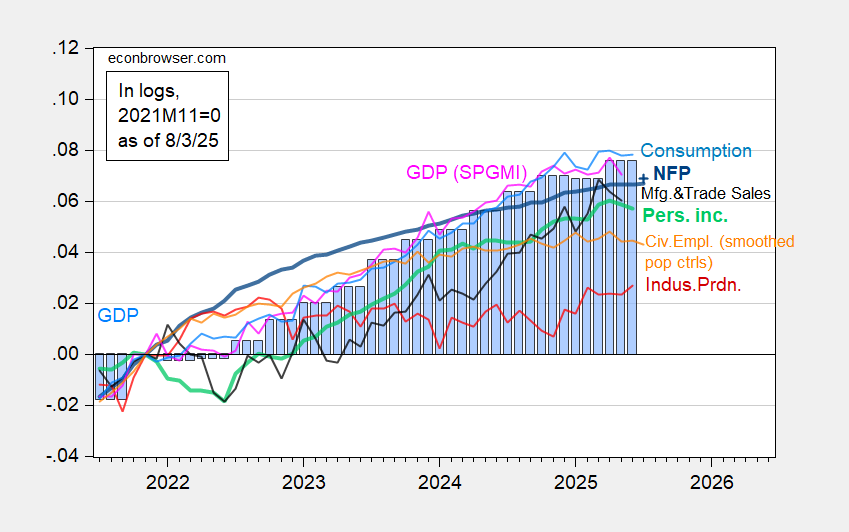
Figure 1: Nonfarm Payroll from CES (bold blue), implied NFP Bloomberg consensus as of 7/1 (blue +), civilian employment with smoothed population controls (orange), industrial production (red), personal income excluding current transfers in Ch.2017$ (bold light green), manufacturing and trade sales in Ch.2017$ (black), consumption in Ch.2017$ (light blue), and monthly GDP in Ch.2017$ (pink), GDP (blue bars), all log normalized to 2021M11=0. Source: BLS via FRED, Federal Reserve, BEA 2025Q2 advance release, S&P Global Market Insights (nee Macroeconomic Advisers, IHS Markit) (7/1/2025 release), and author’s calculations.
The big NFP miss, usually not visible, is readily apparent in this graph. That’s because of the revisions to previous months. While small relative to annual benchmark revisions, they are noticeable here. Big downward revisions, if memory serves me correctly, are seen around turning points. If one were looking for succor in the household survey, one won’t find it. The civilian employment series has been flat for months. And if one believes trends in the household employment series presage recessions at an earlier point than the establishment series, then start worrying.
Just to recap, consumption, personal income and monthly GDP are all below recent peaks.
Here are some alternative monthly indicators (drawn on same vertical scale as Figure 2):
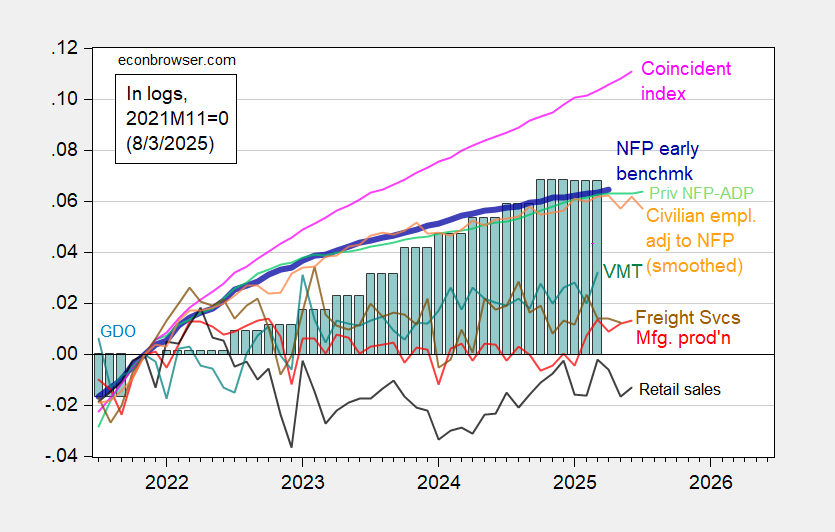
Figure 2: Implied Nonfarm Payroll early benchmark (NFP) (bold blue), civilian employment adjusted to nonfarm payroll concept, with smoothed population controls (orange), manufacturing production (red), vehicle miles traveled (teal), real retail sales (black), and coincident index in Ch.2017$ (pink), BTS Freight Services Index (brown), GDO (blue bars), all log normalized to 2021M11=0. Retail sales deflated by chained CPI, seasonally Source: Philadelphia Fed [1], Philadelphia Fed [2], Federal Reserve via FRED, BEA 2025Q2 advance release, DoT BTS, and author’s calculations.
As discussed here, Mr. Trump’s assertions of rigged data are wildly unjustified, given private NFP as measured by ADP shows the same pattern as the current BLS private NFP series, but on a lower trajectory. If anything, the pre-revision series was less plausible, given the ADP series trajectory.
Retail sales, civilian employment adjusted to NFP concept, and manufacturing production are all below recent peak (albeit insignificantly in the latter case). The coincident index is the only series that is unambiguously rising. The coincident index is based labor market data, so as long as NFP is rising, it’ll rise. With revised employment data, the next iteration of of the coincident indicator will look noticeably different.
So until the establishment series trend downwards, I reserve judgment.
A bit of hopeful news from business applications and expected formations:
https://fred.stlouisfed.org/graph/?g=1L4ZE
Both of the business formation series are looking healthy. Immediately before the Great Recession, both series turned lower; that’s the earliest recession covered by either series. They didn’t weaken ahead of the Covid recession, but we shouldn’t take that too seriously. Both shot up soon after the Covid recession, but not simply because the economy was doing well. Government cash, reluctance to commute and to work in public places and elevated unemployment all contributed to starting home businesses. Who knows? Maybe recent tech layoffs are now causing a rise in formation.
Anyhow, just on the face of it, applications and expected formations look like good signs.
Way off topic, and so very sorry for abusing the comments section, but I’m seriously annoyed.
Anyone else getting a new flood of political fundraising texts? Perhaps following a relentless flood of such texts during the 2024 campaign?
You may be a target of Mothership Stategies. Back in 2023, Politico reported that Mothershop had been dumped by mainstream Democratic campaign organization for its bad behavior during the 2022 midterms, but had found new clients among PACs:
https://www.politico.com/news/2023/11/24/mothership-strategies-democratic-fundraising-00128548
That article reported that Mothership kept 38% of funds raised during the midterms, vs an industry standard of between ten and twenty percent. Sound bad? Read on.
A guy on Substack with skill at following political money has published a more recent analysis of Mothership’s finances, based on FEC filings:
https://data4democracy.substack.com/p/the-mothership-vortex-an-investigation
The upshot is that this leach has gotten much worse now that legitimate campaigns no longer deal with them. At the top of the piece is the assertion that only $11 million of $282 million raised made it to political campaigns. That’s 3.9%. It’s odd that the author chose to put those figures up top, given this bit, further down in the article:
“…at most, $11 million of the $678 million raised from individuals has made its way to candidates, campaigns, or the national party committees.”
That’s only 1.6%.
Please, please, please, tell everyone you know that they should never fall for political fundraising texts. Give directly to the candidate or party of your choice, or get played. Those are your choices
Oh, by the way, this is not just a scam for Democrats. This whole breathless “you need to act now or we’re doomed!” approach to marketing has been aimed at Republicans – survivalists, goldbugs, gun nuts, racists, tax avoiders – for decades.
In fact, low pass-through is a problem for charitable giving in general. This article is one of ever-so-many which names charities that pass almost none of the money they collect to actual charitable purposes:
https://smartasset.com/mortgage/the-50-worst-charities-in-america-how-to-keep-from-being-scammed
Give wisely.
The guy who fired the BLS commissioner yesterday because he claimed their numbers weren’t accurate, today claimed — again — that he reduced drug prices by 1,500%.
Also, today, Kevin Hassett on Meet the Press says that Trump wants to put his own people in the BLS to make sure the numbers are right. So it’s not just the commissioner. He wants to replace the people who are actually responsible for compiling the numbers.
Like Shrub did at intelligence agencies to justify his illegitimate war.
More like the Nixon Jew List. Just like Trump today, Nixon believed that people in the BLS were deliberately undermining him with bad numbers as stagflation started to bite. Sound familiar? He was convinced it was Jews in the BLS and demanded a list be made of anyone with Jewish sounding names so they could be fired or transferred.
Democratic politicians seem to be pretty feckless about all this. Why would people vote for them if they are unwilling to fight?
https://en.wikipedia.org/wiki/Nixon_Jew_count