From Cleveland Fed, Goldman Sachs, plus Bloomberg consensus – generally, acceleration in the q/q annualized:
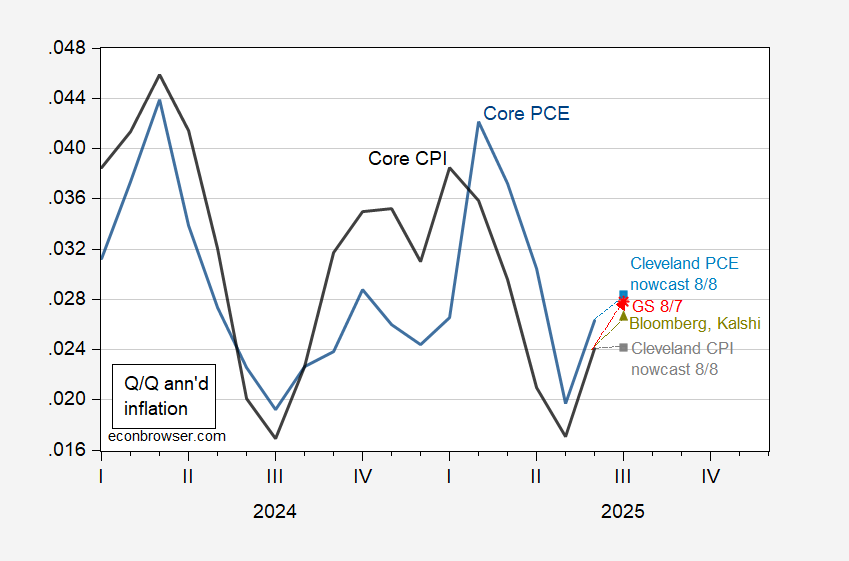
Figure 1: Quarter-on-Quarter annualized inflation of CPI (bold black), Cleveland Fed nowcast as of 8/8 (gray square), Bloomberg consensus, Kalshi betting CT (chartreuse triangle), Goldman Sachs as of 8/7 (red *), inflation of PCE (bold blue), Cleveland Fed nowcast as of 88 (light blue square). Source: BLS, BEA, Cleveland Fed accessed 8/8, Bloomberg, Kalshi accessed 8/8 noon CT, Goldman Sachs, and author’s calculations.
Note that the core CPI nowcasts from the Cleveland Fed do not rely on information such import prices, but rather past CPI only, while the core PCE relies on past CPI and PCE information, as discussed here. This stands in contrast to the headline CPI and PCE nowcasts which rely on additional information (e.g. gasoline prices). Hence, whether to put more faith on the nowcasts (restricted information but transparent), or tracking (presumably more information and more ad hoc, but less transparent) requires a tradeoff. The Cleveland Fed authors have at least documented how their methodology outperforms MIDAS and dynamic factor model approaches.
The Yale Budget Lab has published estimates of the effects of the latest round of tariffs:
https://budgetlab.yale.edu/research/state-us-tariffs-august-1-2025
Some of the main findings:
“The price level from all 2025 tariffs rises by 1.8% in the short-run, the equivalent of an average per household income loss of $2,400 in 2025$. This assumes the Federal Reserve does not react to tariffs and so the real income adjustment comes primarily through prices rather than nominal incomes; if the Federal Reserve reacted, the adjustment could in part come in the form of lower nominal incomes.”
“US real GDP growth over 2025 and 2026 is -0.5pp lower each year from all 2025 tariffs. In the long-run, the US economy is persistently -0.4% smaller, the equivalent of $120 billion annually in 2024$.”
“The unemployment rate rises 0.3 percentage point by the end of 2025 and 0.7 percentage point by the end of 2026. Payroll employment is 497,000 lower by the end of 2025.”
A 0.5% slowing in growth and a 1.8% rise in the price level faces the Fed with a dilemma. If the Fed accommodates, there’s a risk of building in a persistent inflationary impulse. Under Volcker, faced with exactly that problem, the Fed chose to kill off inflation in the near term, and damn the torpedoes. Conditions are different now, but not utterly so. A supply shock via imports is the main culprit both times. Back then, we’d had guns-and-butter. Now, we have the big bloated bill.
The jobless rate estimate implies a recession next year, maybe this year, according to the Sahm rule. No need to quibble about immigration, either, because the estimated jobless rate rise is based entirely on the supply shock.
Note the bit about adjustment through either inflation or Fed-induced income losses. That’s Volcker.
Market pricing took the latest jobs data to mean the Fed is now more likely to ease. That’s based on developments in the data more than eggheads’ estimates. It also takes into account Fed officials own stated views, which can change. Big question whether that market view persists in the face of inflation data heating up. Big question whether Fed folk will agree with market pricing.
Off topic – Germany having its own China shock:
https://cepr.org/voxeu/columns/china-shock-hits-germany
Tha argument is that Germany is now experiencing the same hollowing out of manufacturing that the U.S. suffered two decades ago, as the result of Chinese imports. Seems right. Here’s Germany’s current account balance:
https://fred.stlouisfed.org/series/DEUB6BLTT02STSAQ
A summary of recent bilateral trade developments:
“In May 2025, Germany exported €6.9B and imported €14B from China, resulting in a negative trade balance of €7.06B. Between May 2024 and May 2025 the exports of Germany decreased by €587M (7.85%) from €7.48B to €6.9B, while imports increased by €1.11B (8.6%) from €12.9B to €14B.”
https://oec.world/en/profile/bilateral-country/deu/partner/chn
China is exporting its economic weakness to Germany. The author of the VoxEU piece, Dalia Marin, argues that China should be required to enter into joint ventures with German firms and to transfer technology to those firms in order to sell into German markets. Not subtle, but fair.
This is not the sort of policy recommendation conventional economists were making a decade ago. China’s export success and the political coarsening it has caused among its trading partners has caused some major rethinking. The U.S. felon-in-chief has made a hash of policy, but the conditions which brought him to power are threatening the political consensus elsewhere, and that’s bound to show up in policy discussions.
Putin is meeting Trump in Alaska next week.
I’m guessing that after Putin’s two-hour history lecture, Trump will give him back both Ukraine and Alaska.