That’s the implication of this table:
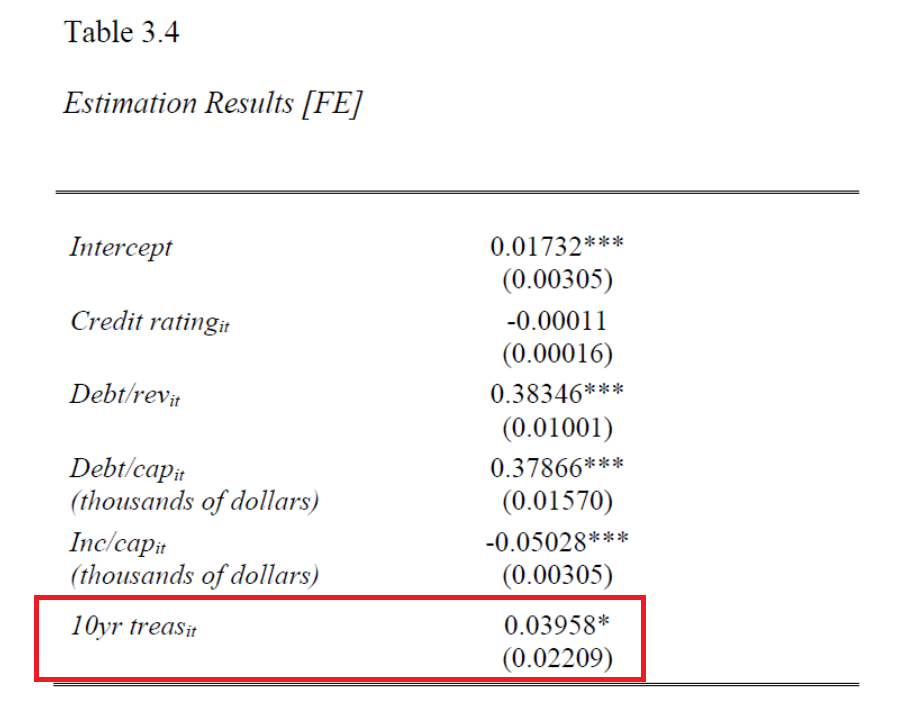
Where the dependent variable is the state municipal bond interest rate proxied by dividing coupon payments by outstanding state debt, for 50 states.
The author’s main concern is with the credit rating variable (which shows up as an ordered dummy variable, 1=BBB-, 10=AAA). However, to me, one interesting coefficient is on the 10 yr Treasury yield, 10yr treas: 0.04 (significant at the 10% msl).
The author writes:
…there is also the possibility that the small coefficient on the 10-year Treasury is the result of misspecification, but structural improvements on the model are left to future research.
I think that any careful analyst would (1) look at the data, (2) compare the estimates obtained to those in the literature, and (3) check to see if one understood the units these variables were measured in. On (1), the author did not provide time series graphs (nor did I see the sample period, although I know it’s 10 years), so I grabbed a time series plot of averages:
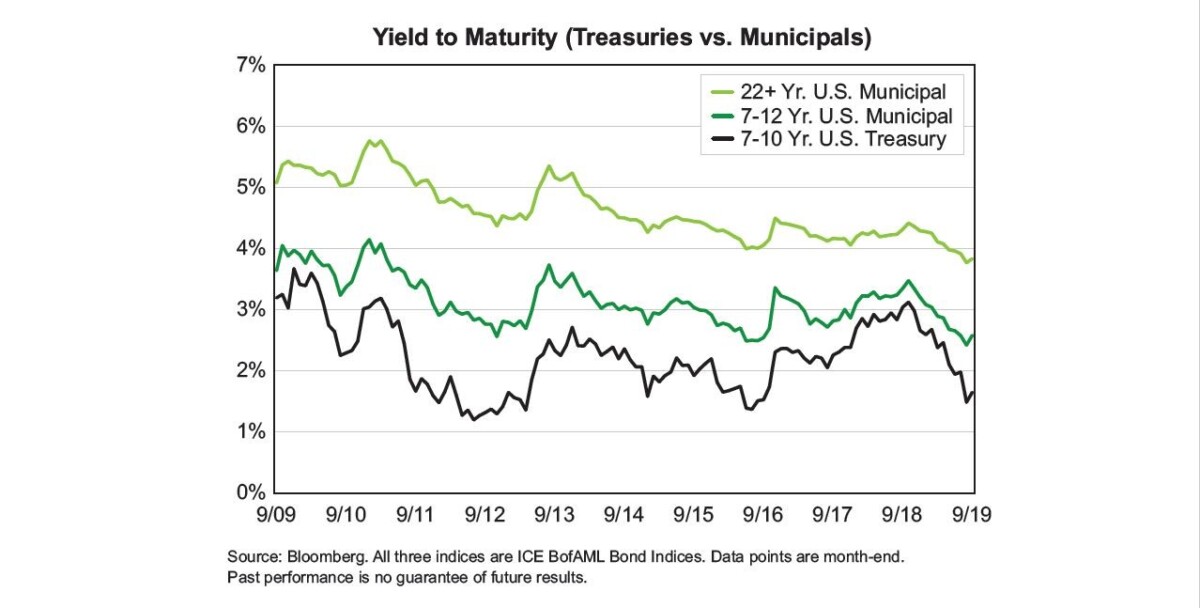
Source: Mironas (2019).
While these are yields for all muni’s (state and local), they give an idea of the magnitudes in involved.
However, here’s the summary statistics for the data set used in this paper.
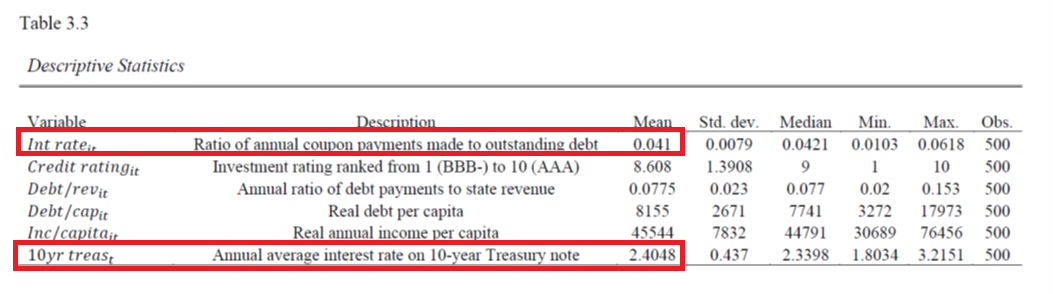
Notice the interest rate mean for state municipal bond yields as proxied is 0.041, while the annual average interest rate on 10 year Treasury notes is 2.4048. This suggests to me the author has slipped in the ratio (in decimal points) for the dependent variable, and the percent rate for the 10 year Treasury. Either is good, but in order to make the coefficient comprehensible, I would’ve either used the decimal formulation for both, or the % formulation for both.
Hence, the percentage point for percentage point coefficient is not 0.04, but rather 4. I’d say this is a large — rather than small — coefficient. I’d guess on the basis of Crowder-Wohar (RevFinEcon, 1999) that a coefficient on the order of 1.3-1.4 was more likely.
We all make mistakes; however the fact that the author was unwilling to investigate this odd result bodes ill.
As an aside, for a key coefficient like credit rating, I would have allowed a nonlinear transformation (say dummy for AAA, dummy for AA, dummy for all the B’s, etc.). Or at least try alternatives to check for robustness.
The author of this work is EJ Antoni (Chapter 3, dissertation).
I’m slack jawed. Ignore the fact that we know who wrote it – for now. Who was his advisor? How does “let somebody else figure out my own result, which I don’t understand” get a checkmark? How do neither the author nor the advisor not call a halt and figure out what went wrong? Why didn’t “maybe it’s just an order-of-magnitude issue” jump out at somebody? And how is the writing so unclear that Menzie has to guess at the data series?
No wonder this punk turned to a life of crime. The education system failed him.
Great insight. I admire your willingness to devote the time required to expose his sloppiness.