Freight transportation services, vehicle miles traveled, civilian employment adjusted to NFP concept all below recent peaks. Heavy truck sales down 17% y/y.
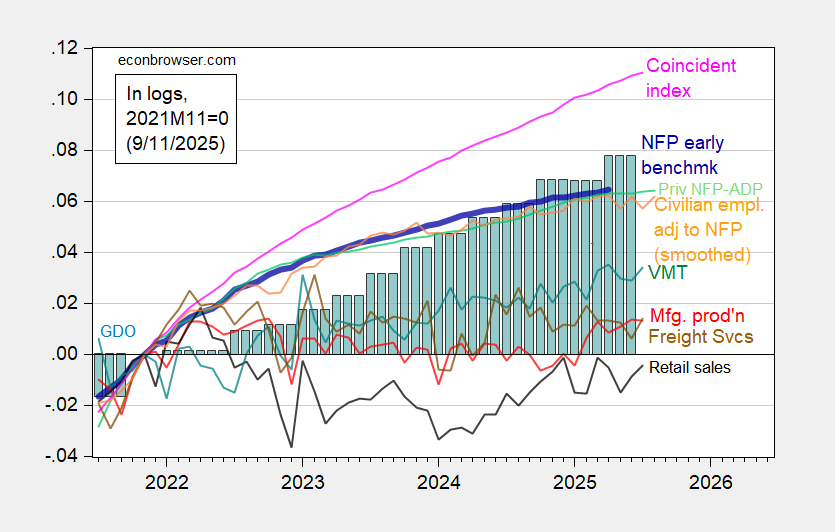
Figure 1: Implied Nonfarm Payroll early benchmark (NFP) (bold blue), civilian employment adjusted smoothed population controls (bold orange), manufacturing production (red), personal income excluding current transfers in Ch.2017$ (bold green), real retail sales (black), vehicle miles traveled (tan), and coincident index in Ch.2017$ (pink), GDO (blue bars), all log normalized to 2021M11=0. Source: Philadelphia Fed [1], Philadelphia Fed [2], Federal Reserve via FRED, BEA 2025Q2 second release, and author’s calculations.
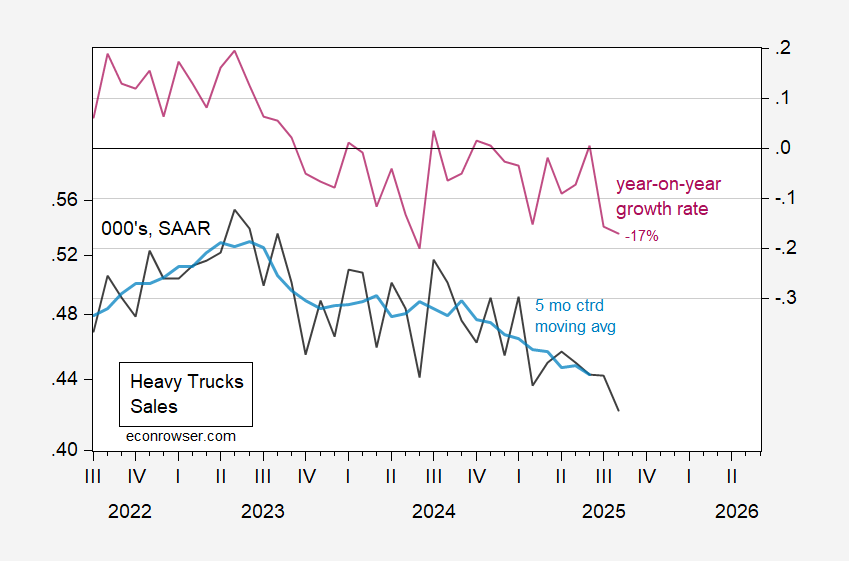
Figure 2: Heavy truck sales (black, left log scale), and 5 month centered moving average (light blue, left log scale), both 000’s, SAAR, year on year growth rate (burgundy, right scale). Source: Census via FRED, author’s calculations.
While heavy truck sales are down relative to recent peak, they aren’t yet at rates associated with recessions.
Stagflation.
I am going to quibble about the decline in heavy truck sales being recessionary or not. Here is the decline in heavy truck sales from their expansion peaks to the start of recessions in the past (I’ve excluded the recession caused by the Giant Flaming Meteor of Death, a/k/a Covid, for obvious reasons):
1970: 0%
1973: 12.3%
1980: 35.1%
1981: 24.5%
1991: 18.0%
2001: 30.7%
2008: 44.2%
Median: 24.5%
Average: 23.5%
Present: 23.7%
So at least by this measure heavy truck sales are presently recessionary.