The CEA-OMB-Treasury (“Troika”) forecast looks out of line with the CBO projection and the SPF median forecast.
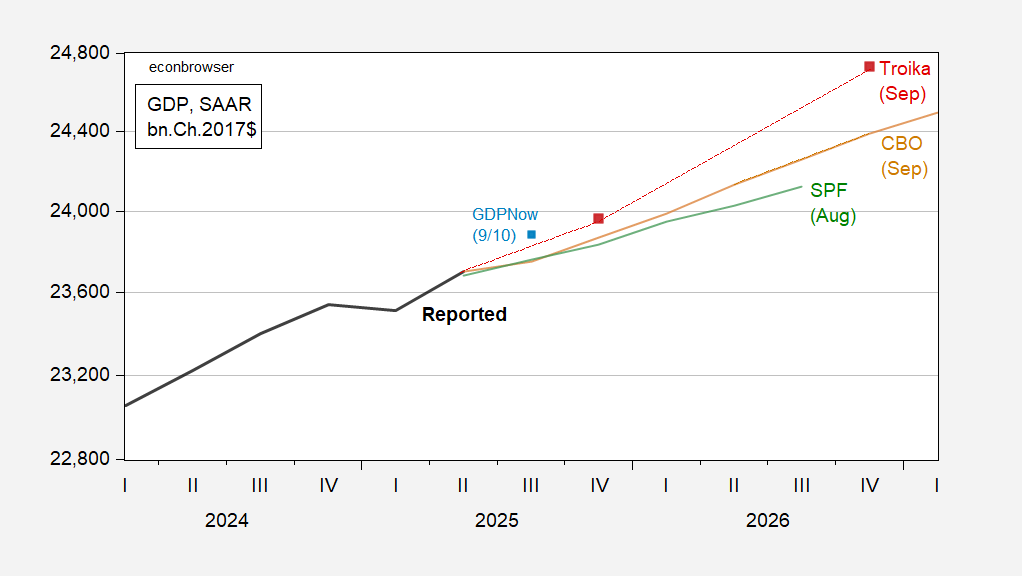
Figure 1: GDP as reported (bold black), CBO projection (tan), Administration forecast (red squares), Survey of Professional Forecasters median forecast (green), and GDPNow of 9/10 (light blue square), all in bn.Ch.2017$ SAAR. Source: BEA 2025Q2 second release, CBO Current Economic Outlook, OMB Mid-Session Review Technical Supplement, Philadelphia Fed (August 2025), and author’s calculations.
The administration forecast is substantially outpacing the CBO and SPF in the out-years. From the CBO report:
The major factors underlying most of the changes in CBO’s projections are the 2025 reconciliation act (Public Law 119-21), higher tariffs, and lower net immigration (the number of people who enter the United States in a given period minus the number who leave in that period).3 CBO’s updated projections also reflect interactions among those factors as well as data released since January. Those data include equity prices and inflation that were higher, and residential investment that was weaker, than in CBO’s January projections—reflecting, in part, higher interest rates and a slower rate of household formation than previously projected.
The pattern of economic growth over the next several years reflects differences in the timing of the effects on the economy of the reconciliation act and of the changes in tariffs and net immigration:
- In 2025, the growth of real gross domestic product (GDP)—that is, the nation’s economic output adjusted to remove the effects of changes in prices—is 0.5 percentage points lower in CBO’s current projections than it was in the agency’s January 2025 projections, primarily because the negative effects on output stemming from new tariffs and lower net immigration more than offset the positive effects of provisions of the reconciliation act this year (see Figure 1).
- In 2026, the reconciliation act’s effects boosting growth dominate the effects slowing it that stem from the reduction in net immigration. Waning of the elevated uncertainty about trade policy provides modest support to economic growth next year as supply chains begin to adjust to the higher tariffs. Growth next year is 0.4 percentage points higher than in the previous projections, reflecting the reconciliation act’s boost to consumption, private investment, and federal purchases and the diminishing effects of uncertainty about U.S. trade policy.
- …
As noted in this post, the Troika forecast seems unlikely to be realized, if GDP follows an ARIMA(0,1,0).
Near term, given the distortions in measurement arising from tariff front-running, it’s more interesting to look at comparisons of final sales to private domestic purchasers (aka “core GDP”) as a measure of aggregate demand. We don’t have the detailed information to recreate the Administration’s estimate of this variable, but we do for the SPF.
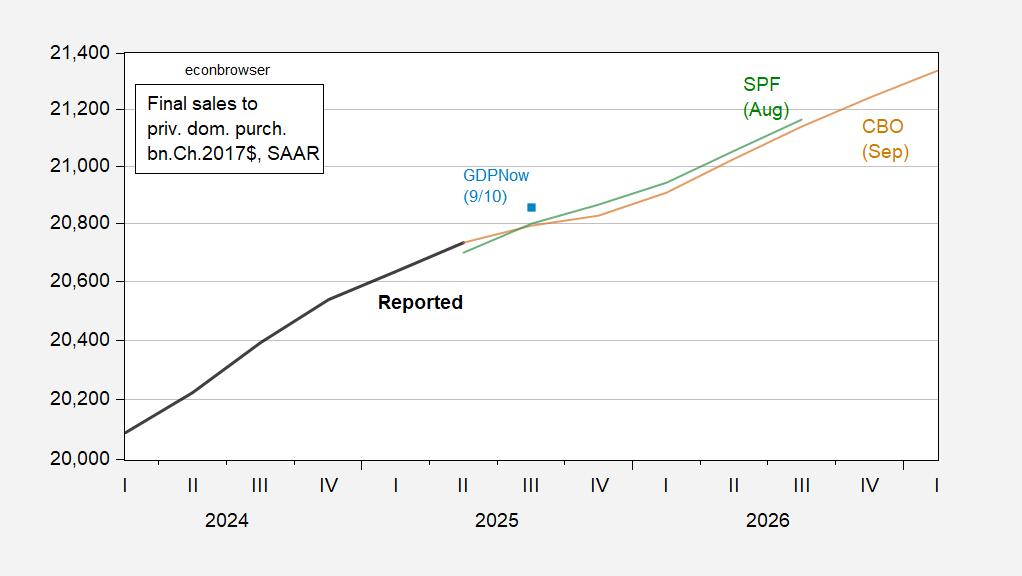
Figure 2: Final Sales to Private Domestic Purchasers as reported (bold black), CBO projection (tan), Survey of Professional Forecasters median forecast (green), and GDPNow of 9/10 (light blue square), all in bn.Ch.2017$ SAAR. CBO and GDPNow series estimated summing up projections of components. Source: BEA 2025Q2 second release, CBO Current Economic Outlook, OMB Mid-Session Review Technical Supplement, Philadelphia Fed (August 2025), and author’s calculations.
CBO matches the SPF median trajectory fairly closely. Presumably, the administration’s would be substantially higher. Both CBO and SPF median indicate a substantial slowing in growth of “core GDP” (note both figures are on a log scale).