As of yesterday, here.
Here’s the Troika (OMB, CEA, Treasury) forecast, plotted against SPF, IMF, and GDPNow (9/4). CBO projections will be out later this month.
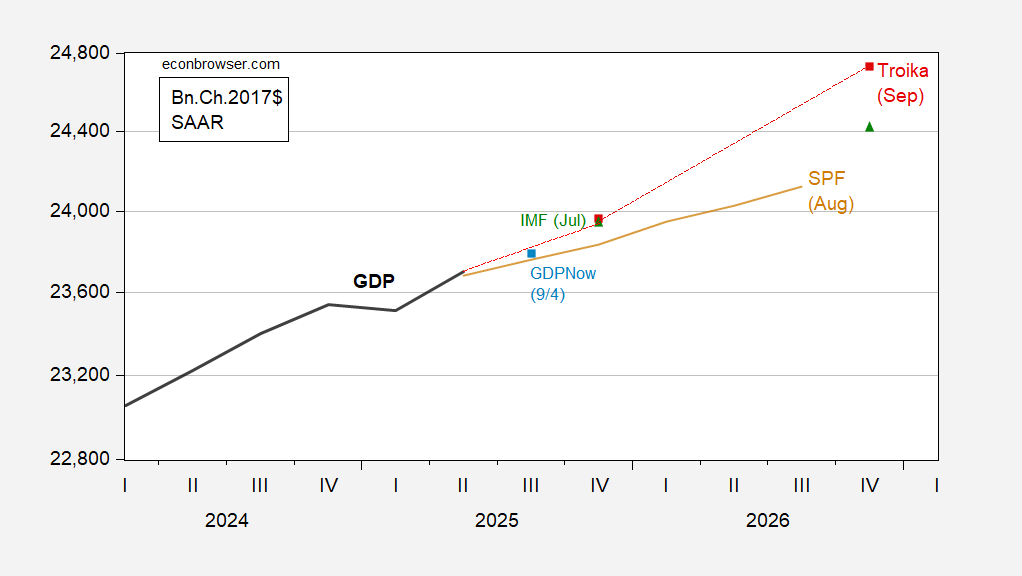
Figure 1: GDP (bold black), Mid-session Review Troika forecast (red squares), IMF July WEO (green triangle), Survey of Professional Forecasters August median (tan), and GDPNow of 9/4 (light blue square), all in bn.Ch.2017$, SAAR. Source: BEA second release, OMB, IMF, Philadelphia Fed, Atlanta Fed, and author’s calculations.
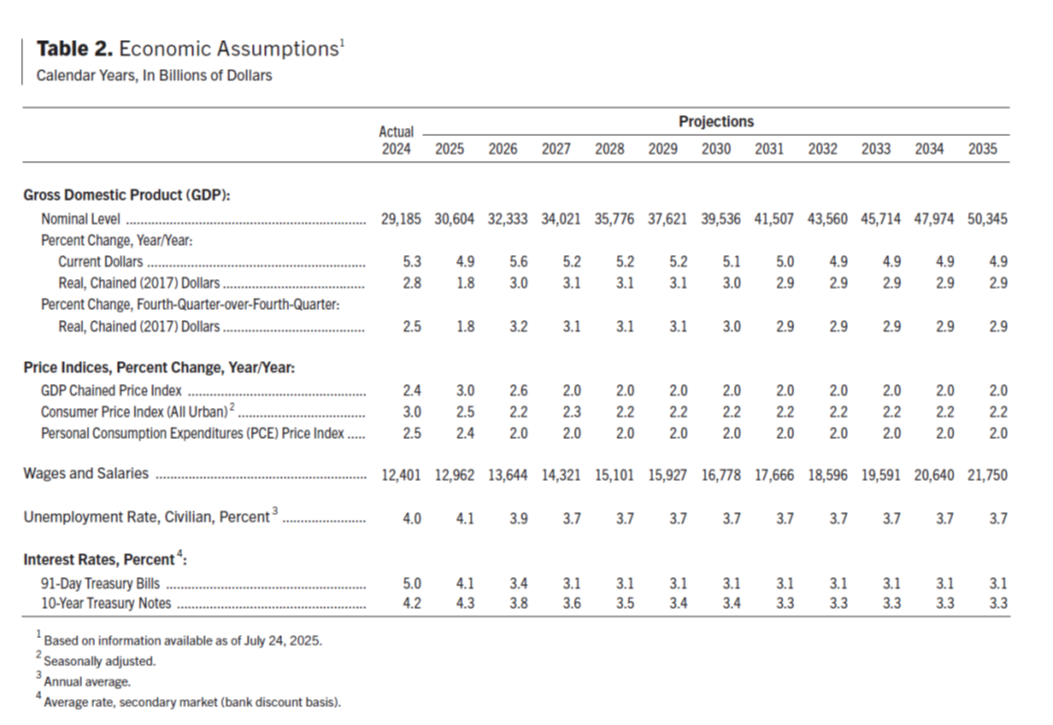
How does the Troika GDP forecast get so high? It’s from deregulatory benefits, as sourced from the CEA document on the benefits of deregulation.
To get a better sense of the potential long-run benefits of deregulation, it is instructive to look at rulemaking under the previous administration. Based on estimates from Federal agencies themselves as reported by the American Action Forum, the Biden Administration imposed a record $1.8 trillion in present value in new regulatory costs on the economy. If the potential cost savings from rolling back these rules is annualized over a 20-year period, it is equivalent to a 0.29 percentage point increase in annual economic growth, assuming that every dollar of regulatory cost reduces gross domestic product (GDP) by a dollar and that these regulations have no market benefits.5
However, even those effects come in far below University of Chicago Professor Casey Mulligan’s estimate of $5 trillion in present value regulatory costs in Biden Administration rulemaking, when properly accounting for resource and opportunity costs that, in his assessment, were not captured in the official estimates.6 If Professor Mulligan’s estimate is used, the potential long-run cost savings from rolling back these rules increase to 0.78 percentage points annually.
The $5 trillion estimate comes from a Committee to Unleash Prosperity document, written by Casey Mulligan. (The Committee to Unleash Prosperity was cofounded by Arthur Laffer and Steve Moore; those two are associated with ALEC’s publication, Rich States, Poor States. As discussed here, there is no empirical content to their economic outlook index).
Is it possible we’ll get this outcome? Yes, based on a simple random walk with drift estimated 2022-24, at least through 2026. 2027 and thereafter, a little iffy.
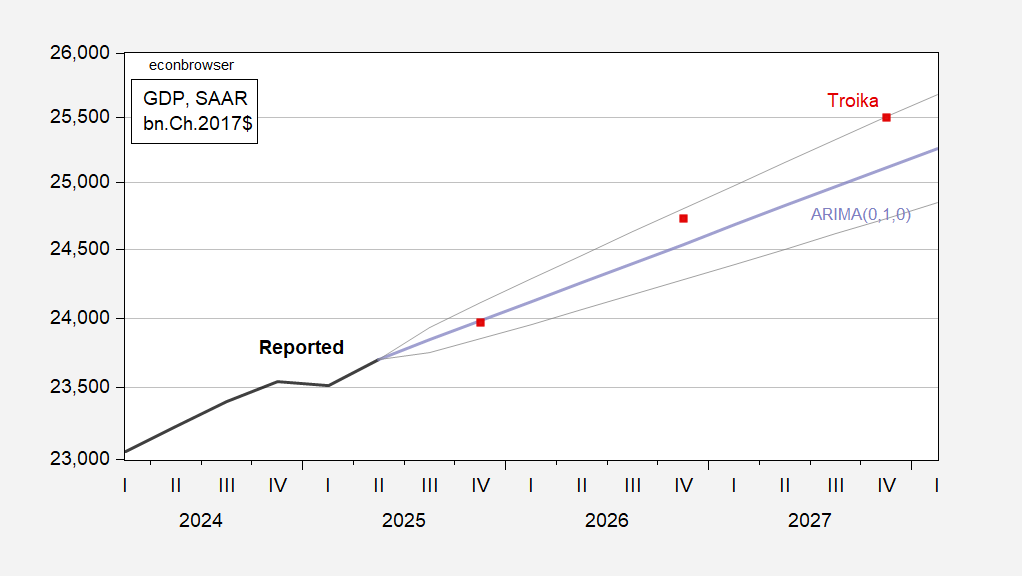
Figure 2: GDP (bold black), Mid-session Review Troika forecast (red squares), random walk with drift forecast estimated 2022-24 (tan), +/- one std error band (gray) all in bn.Ch.2017$, SAAR. Source: BEA second release and author’s calculations.
More forecasts from the MSR here:
See this post for dynamic feedback estimates.
CBO’s current view of the economy, coming out September 12.
I would like to love to hear some economists here react to Scott Bessent’s WSJ piece: https://www.wsj.com/opinion/the-feds-gain-of-function-monetary-policy-ac0dc38a
Wolf Richter doesn’t pull any punches: https://wolfstreet.com/2025/09/05/bessent-blasts-the-fed-for-qe-its-perverse-incentives-for-fiscal-irresponsibility-its-wealth-effect-policies-that-widened-clas/ “There is nothing more toxic on society, as far as central-bank policies is concerned, than the pursuit of the Wealth Effect. And it’s bipartisan: Yellen was appointed by a Democrat and Bernanke by a Republican.”
I’ve been following liberal economists’ opinion pieces for over a decade and have noticed their reluctance to talk about the wealth effect. Instead, they talk about how much ZIRP and QE would help working Americans. Of course, if you look at the historical data, the beneficiaries of Fed policy were first and foremost share prices on the stock market, which reached record highs within 5 years along with bank profits, which took even fewer. Meanwhile the supposed beneficiaries watched as the unemployment rate took a full decade to reach its pre-recession lows and real weekly earnings most of a decade.
And so here we are today. Record wealth and inequality. Half of retail sales attributable to the top 10%, who pig out while keeping the economy going, while 70% struggle to make ends meet. https://www.adeccogroup.com/future-of-work/latest-insights/70-percent
What say liberal economists now about the Fed’s wealth effect?
There are two counter-cyclical tools available to policymakers – monetary policy and fiscal policy. The Fed only makes monetary policy. Monetary policy works through a number of channels, including the wealth effect. Yellen discussed the wealth effect because she is honest and knows how monetary policy works. Honesty is not evidence of a preference for enriching the rich.
There are elements of monetary policy, such as paying interest on reserves at the Fed, which need to be rethought. Banks piled up enormous reserves at the Fed, generating profits without making productive loans – and while avoiding risk. Bank shareholders having access to risk-free profits while contributing nothing to the economy is rotten. The wealth effect is just a fact of life, but doesn’t need to be generated in a rotten way.
If fiscal policy were run for the good of all, the Fed wouldn’t have needed to rely so heavily on enrichment of the rich. Biden tried that and the public turned against him; I don’t expect fiscal policy for the good of all will be tried again very soon. Instead, we now have fiscal policy that enriches the rich. That’s who we are.
Pretty cheeky of Bessent to complain about the failure of Silicon Valley Bank when it was Bessent and his ilk who lobbied to roll back the Fed’s stress tests in Dodd-Frank to deregulate regional banks like SVB.
If we take the American Action Forum’s tally at face value, we still can’t take the troica’s math at face value (big surprise). Where’s the subtraction to account for the felon-in-chief’s tariff and immigration policies, his attack on institutions and the rule of law?
Note also that, as is pretty much always the case with governmental and multinational institutions’ forecasts, this one includes no recession. A recession at some far-in-the-future time doesn’t matter much to the outcome, but a near-term recession knocks these “estimates” all to hell.
Anybody think odds of a recession in the near term are low?
Off topic – When deportation is just an effort to run up the score, we get stories like this:
https://www.thetimes.com/us/news-today/article/trump-putin-working-together-fsb-kl7c0cjlg
Russian dissidentsare being sent back to Russia, with their asylum application files. Those files include applicants’ accusations against Russian authorities.
Meanwhile, the share of Americans who think immigration is a good thing is now at 79%, a record high:
https://news.gallup.com/poll/692522/surge-concern-immigration-abated.aspx