That’s the title of an article reprinted at the Heritage.com, by current BLS Commissioner-nominee EJ Antoni,
…an increasing number of indicators say the recession has arrived in the broader economy.
Typically, the economy grows as population and productivity increase, expanding total production, income and consumption. When that growth stagnates and reverses into contraction, we call it a recession. Production declines, and people have a lower quality of life.
The most common measure for growth or contraction in the economy is gross domestic product (GDP), which estimates total spending. It’s imperfect, like any estimate, but those imperfections are becoming highly problematic today.
The article was posted on August 22, 2024. For reference, here is the latest available data, including GDP.
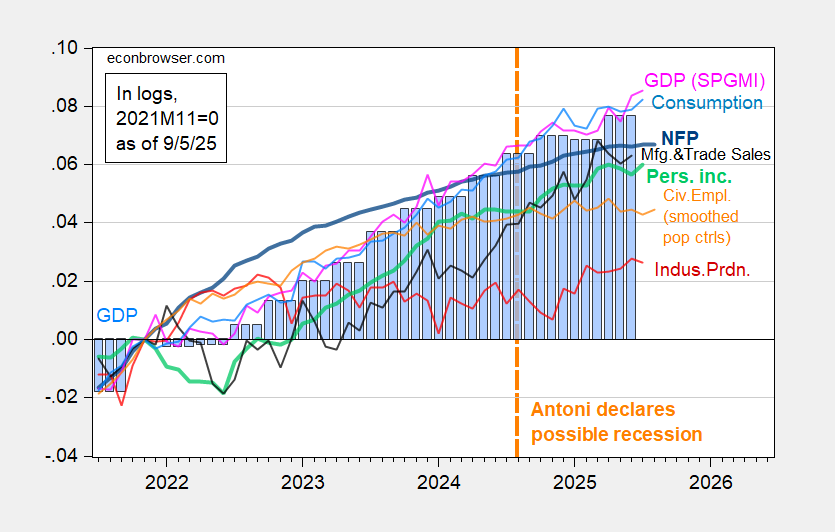
Figure 1: Nonfarm Payroll from CES (bold blue), civilian employment with smoothed population controls (orange), industrial production (red), Bloomberg consensus industrial production of 8/14, (red square), personal income excluding current transfers in Ch.2017$ (bold light green), manufacturing and trade sales in Ch.2017$ (black), consumption in Ch.2017$ (light blue), and monthly GDP in Ch.2017$ (pink), GDP (blue bars), all log normalized to 2021M11=0. Source: BLS via FRED, Federal Reserve, BEA 2025Q2 second release, S&P Global Market Insights (nee Macroeconomic Advisers, IHS Markit) (9/2/2025 release), and author’s calculations.
Note that while industrial production was below recent peak as of August 2024, all other indicators continued to rise, including GDP. Now, these are the most recent-vintage numbers. To be fair, we should examine the numbers EJ Antoni had in real time. As it happens, I recorded these series at the time Dr. Antoni made his statement, in this August 2024 post.
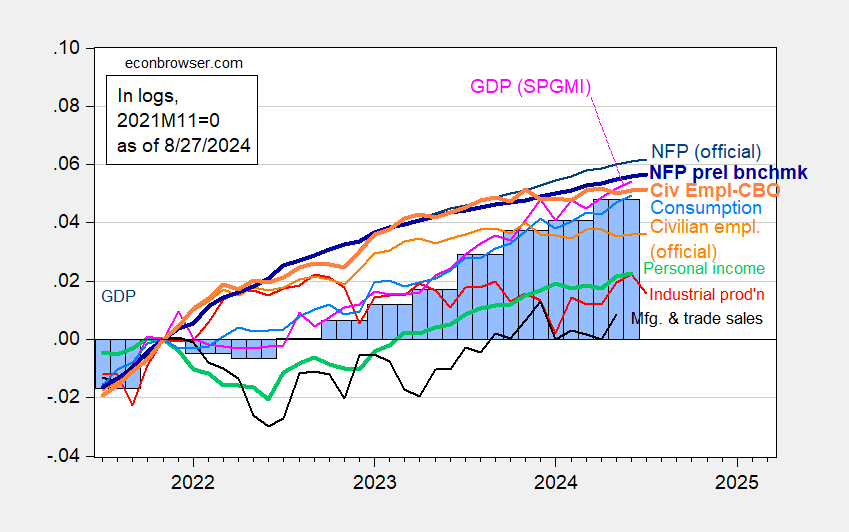
Figure 2: Nonfarm Payroll (NFP) employment from CES (blue), NFP implied preliminary benchmark revision (bold blue), civilian employment (orange), implied civilian employment using CBO estimates of immigration (bold orange), industrial production (red), personal income excluding current transfers in Ch.2017$ (bold green), manufacturing and trade sales in Ch.2017$ (black), consumption in Ch.2017$ (light blue), and monthly GDP in Ch.2017$ (pink), GDP (blue bars), all log normalized to 2021M11=0. Source: BLS via FRED, Federal Reserve, BEA 2024Q2 advance release, S&P Global Market Insights (nee Macroeconomic Advisers, IHS Markit) (8/1/2024 release), and author’s calculations.
Note as of end-August 2024, most series followed by the NBER Business Cycle Dating Committee (BCDC) were still rising. While industrial production was declining, industrial output only comprises 17% of US GDP. On the other hand, as of end-August vintages, nonfarm payroll employment (even after preliminary benchmark downward revision!) and personal income excluding current transfers — the two key variables emphasized by the NBER BCDC — were rising! (Official civilian employment was flat, but if Dr. Antoni had been aware of the concerns regarding the population controls used by the BLS, then he would’ve noted the downweighting that should have been ascribed to this variable; sadly, he other was unaware, or chose not to mention, casting doubt on his reliability as an analyst of economic data).
you yanks should be so thankful you have the recession whisperer living there.
Russians invade Polish airspace. So Trump issues an ultimatum …
to NATO.
Way-the-heck off topic and pretty obscure, but I think we may get a “surprise” from the FOMC that isn’t meant to be a surprise.
The FOMC meets next week, and is widely expected to cut the funds rate target band by 25 basis points. What is not widely anticipated, at least in the financial press, is adjustment to the reduction of the Fed’s balance sheet; I’m wondering whether we might get hints.
The Fed’s official policy is to provide “abundant reserves”, which in practice means reserves large enough to absorb shifts in financial market activity without allowing the funds rate – or related interest rates – to deviate from target.
A quick tour of Fed research shows that staff have been studying the heck out of this issue. They know that the run-off of assets is nearing the point at which reserves will no longer be “abundant” by the Fed’s definition.
As an aside, the Treasury’s general account (TGA) with the Fed is among the largest swings in demand for reserves. The Fed typically uses reverse repos to provide the liquidity offset to swings in the TGS.
Here’s reverse repurchase agreement volume:
https://fred.stlouisfed.org/series/RRPONTSYD/
Notice the recent very low volume. That has drawn some attention from market participants. I’m gonna guess that a drop in money fund transactions with the Fed have something to do with this:
https://fred.stlouisfed.org/graph/?g=1Mivu
But I digress. My point is that the Fed is risking a liquidity strain as it continues to run down its asset holdings, and that Fed officials are fully aware of this. They are also aware that they had to cough up half a trillion dollars in liquidity in 2019 because of a miscalculation, and that year-end 2024 gave evidence that “abundant reserves” were not so abundant. If the Fed wants to avoid a bigger hiccup at year-end 2025, it’s time to get busy.
Suffice it to say that the Fed is aware that running down its asset holdings is reaching (has reached) the point at which greater care is needed to avoid liquidity problems.
What happens if the Fed does adjust course on reserve holdings? Among other things, maybe a misinterpretation. Though Fed staff have published and published about the need to stabilize the Fed’s asset portfolio in order to maintain abundant reserves, the general public, politicians and – as far as I can tell – market participants haven’t absorbed what staff research suggests. So we could have a “surprise” that isn’t meant to be a surprise. And we could have a felon-in-chief who claims credit for bullying the Fed into doing something the Fed was going to do anyway. Bad for Fed credibility. Bad for asset pricing if market participants don’t understand Fed policy thinking.
Presumably you are talking about something different from this? It certainly doesn’t look like banks are running out of reserves, especially compared to pre-Recession days.
https://fred.stlouisfed.org/series/TOTRESNS
Yep, different – short-term vs medium-term. Reserves still yield nicely above the rate of inflation, and so generate a profit for banks. While not static, they can be held for as long as the bank wants. Repo transactions are short-term, and are engaged in to manage short-term fluctuations.
So when, for instance, Treasury piles up cash at the Fed, that cash is not available to be held by banks. When the Treasury pays that cash out to private folk, who hold it as bank deposits, banks get an influx of cash that may not stick around. That’s where the repo market comes in. Repo transactions can be with other banks or with the Fed. Problem is, when Treasury disgorged cash to the private sector, banks have abundant deposits and don’t need to borrow much from each other. That leaves the Fed as the marginal player in the market for short-term funds, which is where repo transactions with the Fed come in.
A Trump run Fed would certainly have to stop selling and start buying treasuries, in order to force the rates on 10-30 year bonds down. The rest of the world and many US individual investors are finding US treasuries a risky asset and several auctions have been close to failure.
I can’t remember was the fed reserve going to reduced the balance sheet by 75 or 50 billion per month?
The Sep 11 2025 H4.1 weekly report shows the balance sheet over $6 trillion in assets, down around $500 billion year on year.
Last week the balance sheet rose $3 billion.
The balance sheet is higher then before the Covid rescue.
Yes, much higher. The grpwth of the Treasury general account only accounts for a fraction of the increase in need for uncreased capacity in the Fed’s balance sheet:
https://fred.stlouisfed.org/graph/?g=1MkvX
joseph’s observation that bank reserve holdings are very high is a larger factor:
https://fred.stlouisfed.org/graph/?g=1MkwV
The Fed has chosen to anchor the funds rate by paying interest on bank reserves held at the Fed, and that decision has ended up being highly consequential.
The Fed has settled on holding assets sufficient to insulate fixed income from liquidity swings. We can goggle at the size of Fed holdings all we want, but that’s the policy structure.
Initial unemployment claims
The key indicator I track to establish the onset of a recession.
https://fred.stlouisfed.org/series/ICSA
highest level in 5 years. and since you called a recession in that time span, steven, i assume you are calling a recession once again now?
Really? You used to be that leading VMI dude. I guess you finally wised up.
The NBER business cycle dating committee is of the view that a number of other data series ought to be considered:
“The determination of the months of peaks and troughs is based on a range of monthly measures of aggregate real economic activity published by the federal statistical agencies. These include real personal income less transfers, nonfarm payroll employment, employment as measured by the household survey, real personal consumption expenditures, manufacturing and trade sales adjusted for price changes, and industrial production.”
https://www.nber.org/research/business-cycle-dating
Notably, there is a graph of the U3 jobless rate at the NBER link, even though the U3 rate is not among the data series formally used to establish recession timing. No mention of initial claims. This comparison of claims and U3 shows why:
https://fred.stlouisfed.org/graph/?g=1Mk0c
U3 tends to lead recessions by more than jobless claims. Claims are more coincident than leading. You might want to rethink your reliance on a single coincident index, unless you aim is to discover that a recession is already underway.
If you want to use U3 per your link above, then the trough of the unemployment rate was March 2023, ie, you could call a recession then. That sort of puts you in the Antoni camp. I don’t believe we’ve been in recession for more than two years.
Increasing initial unemployment claims is a leading indicator of recession. New claims are the highest in several years, suggesting a deteriorating trend. If IUCs reach, say, 350,000, I would say that a recession has arguably begun. The Sept. 6 number was 263,000, still pretty low by historical standards.
As for VMT (vehicle miles traveled, not VMI, which is a fine military academy) and oil consumption, I consider these coincident indicators. VMT is reported with a lag, so it’s a lagging coincident indicator, if that makes any sense. Oil consumption, by contrast, is reported weekly (on a proxy basis) or monthly, and therefore can be considered a near-real-time coincident indicator.
cbo claims the trump tariffs are a tax on us consumers, and will save us nearly $4 trillion dollars with the deficit over the next decade. in some perverted way, trump has managed to take a democratic policy goal, increase taxes to pay for the deficit, and get a bunch of republicans to buy into that proposal. never thought i would see fiscal conservatives cheer on a $4 trillion dollar tax hike. but that is washington today. and since most of those tariffs are paid for by the middle and lower class consumers, the wealthy catch a break. and couple that with all of the recent federal cuts that directly affect the middle and lower class, it amazes me that trump has so much support from the blue collar workers who are directly getting screwed by these economic policies. most people really have no clue what is happening to them, as they are too caught up in the culture wars.
Macroduck: “The NBER business cycle dating committee is of the view that a number of other data series ought to be considered:
“The determination of the months of peaks and troughs is based on a range of monthly measures of aggregate real economic activity published by the federal statistical agencies. These include real personal income less transfers, nonfarm payroll employment, employment as measured by the household survey, real personal consumption expenditures, manufacturing and trade sales adjusted for price changes, and industrial production.”
And here are all of the NBER business cycle data series displayed in all their glory in one handy dashboard at FRED (including GDP, GDI, GDO):
https://fredaccount.stlouisfed.org/public/dashboard/84408
Scroll down, look for flattening or downturns. That’s what NBER is looking at. They generally want to see all of them turn negative to call a recession.