Video of proceedings tomorrow (Tues, 9/16) on WisconsinEye [link updated 9/17].
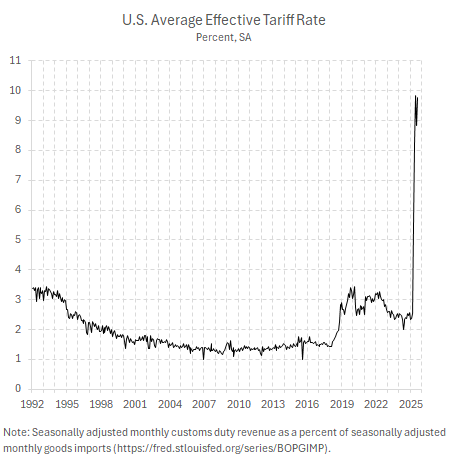
Source: Pawel Skrzypczynski, accessed 9/14/2025.
Particpants:
- Menzie Chinn, an economics professor in UW-Madison’s La Follette School of Public Affairs
- Pam Jahnke, director at the Midwest Farm Report Network
- Buckley Brinkman, executive director and CEO of the Wisconsin Center for Manufacturing & Productivity
- Roberta Oldenburg, director of business development for science and tech at Findorff construction
Graphs from my handout:
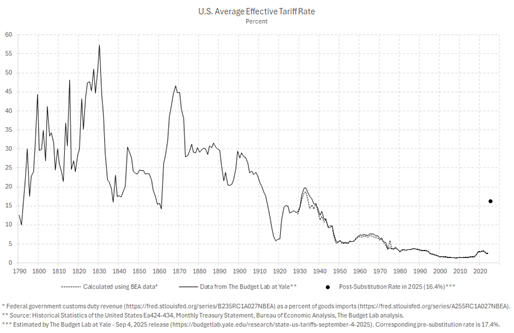
Source: Pawel Skrzypczynski, accessed 9/14/2025.
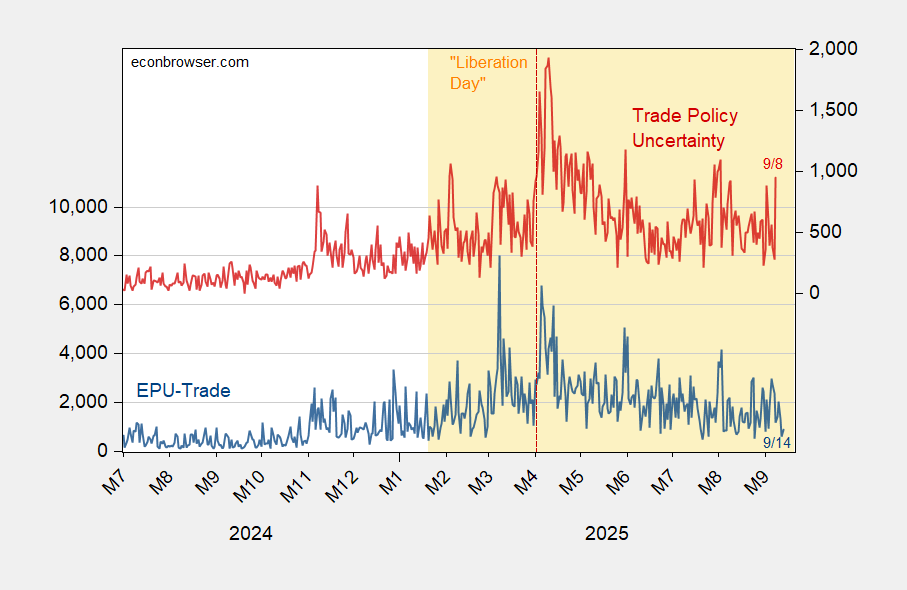
Figure 1: Baker-Bloom-Davis Categorical EPU-Trade (blue, left scale), and Caldara et al. Trade Policy Uncertainty Index (red, right scale). Red dashed line at “Liberation Day”. Source: policyuncertainty.com and tradepolicyuncertainty, accessed 9/14/2025.
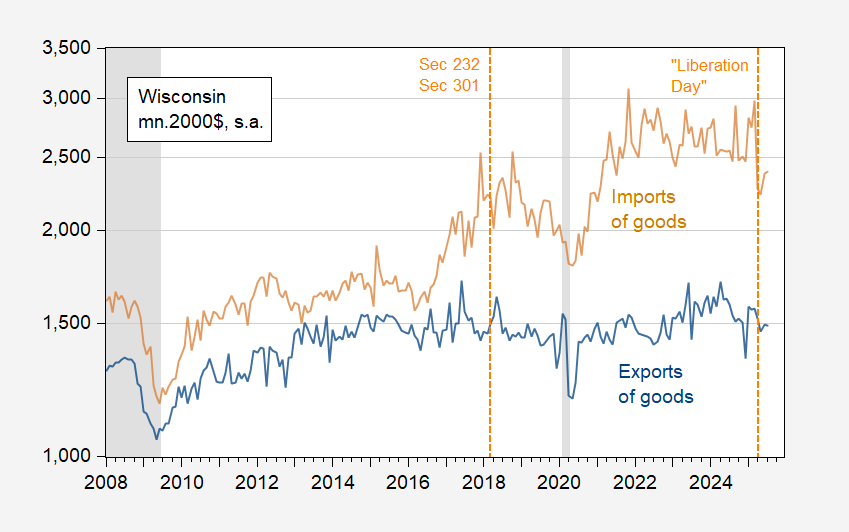
Figure 2: Wisconsin Exports of goods (blue), Wisconsin imports of goods (tan), both in mn.2000$, seasonally adjusted using X-13 by author. Exports deflated by all commodities BLS deflator; imports deflated by all commodities ex-petroleum deflator. NBER defined peak to trough recession dates shaded gray. Source: BEA via FRED, BLS, NBER, and author’s calculations.
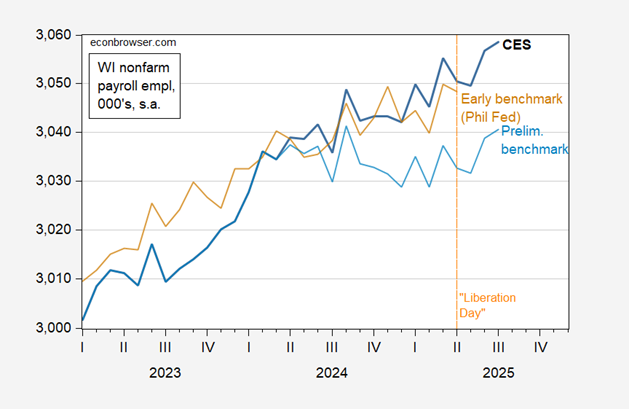
Figure 3: Wisconsin nonfarm payroll employment official (dark blue), preliminary benchmark (light blue), early benchmark (tan), all in 000’s, s.a. Preliminary benchmark incorporates 79K downward revision for March 2025, with intervening 2025M04-2025M03 observations “wedged in”. Source: BLS via FRED, BLS, Philadelphia Fed, and author’s calculations.
Finally, not included in my handout, but relevant given Wisconsin’s relatively high manufacturing share.
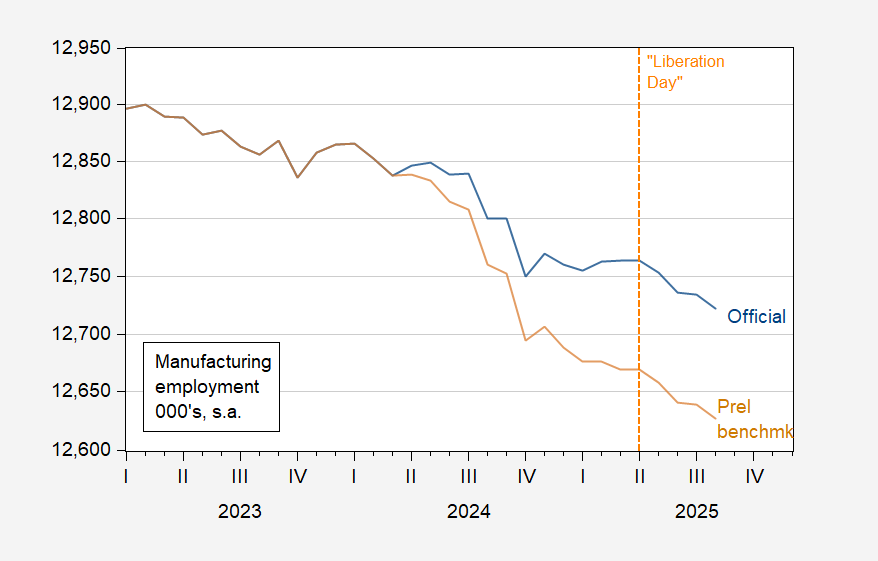
Figure 4: Manufacturing employment official (dark blue), preliminary benchmark (tan), all in 000’s, s.a. Preliminary benchmark incorporates 79K downward revision for March 2025, with intervening 2025M04-2025M03 observations “wedged in”. Source: BLS via FRED, BLS, Philadelphia Fed, and author’s calculations.