Tej Parikh in FT inquires.
He presents growth rates of key indicators followed by the NBER’s Business Cycle Dating Committee (BCDC). Below I show the same indicators in levels (where I’ve replaced the official NFP series with the implied preliminary benchmark NFP using Wells Fargo estimates).
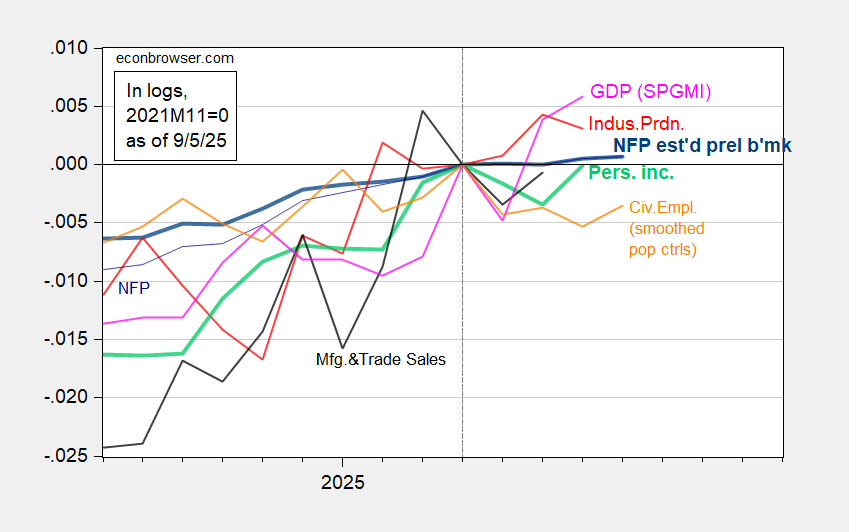
Figure 1: Nonfarm Payroll – estimated preliminary benchmark revision (bold blue), NFP official (thin blue), civilian employment with smoothed population controls (orange), industrial production (red), personal income excluding current transfers in Ch.2017$ (bold light green), manufacturing and trade industry sales in Ch.2017$ (black), and monthly GDP in Ch.2017$ (pink), all log normalized to 2025M04=0. Estimated preliminary benchmark is based on midpoint of Wells Fargo range of downward revision. Source: BLS via FRED, Federal Reserve, BEA 2025Q2 second release, S&P Global Market Insights (nee Macroeconomic Advisers, IHS Markit) (9/2/2025 release), and author’s calculations.
I normalize on April 2025 because that’s the peak in civilian employment, and there’s some evidence that civilian employment peaks before NFP in real time, just before recessions.
It’s clear that nonfarm payroll employment growth has slowed to a crawl, a slowdown more pronounced if one used the official series. We have the official preliminary benchmark revision on Tuesday (9/9), and the Philadelphia Fed early benchmark on 9/19.
The evolution of civilian employment is shown below.
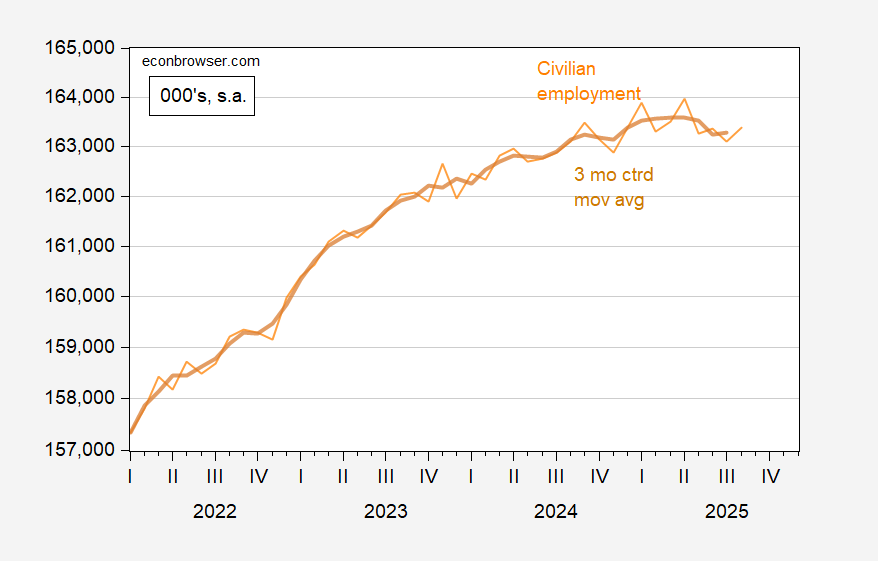
Figure 2: Civilian employment, smoothed population controls experimental series (orange), and 3 month centered moving average (dark orange), in 000’s, s.a. Source: BLS and author’s calculations.
Since the household survey based employment series is more volatile than the NFP, it makes sense to take a moving average. This transformation confirms that civilian employment is past recent peak…
Secretary Bessent was on Meet the Press Sunday. From the evasions in his answers, it sounds like the White House is starting to panic that their economic policies are failing.
Question: Goldman Sachs says 86% of the tariff revenue collected so far has been paid by American businesses and consumers. Do you acknowledge that these tariffs are a tax on American consumers?
Bessent: No, I don’t.”
Question: What do you say to companies like John Deere who say these tariffs are hurting them?
Bessent: If you’re quoting the NYT, that’s not a fair observer.
Question: These are statistics. This is about John Deere, not the NYT.
Bessent: That’s one company they have cherry picked.
Question – The president said the tariffs were gonna spark a manufacturing renaissance, but since he announced them in April the US has actually lost 42,000 manufacturing jobs. Are these numbers proof that the tariffs are failing?
Bessent: It’s been a couple of months. We can’t snap our fingers and have factories built.
Question – The economy did add nearly 500,000 manufacturing jobs under President Biden.
Bessent: Most of the jobs created under the Biden admin went to illegal aliens.
Bessent on the terrible jobs report: If in fact these numbers are true, it shows that President Trump was right about the Federal Reserve. They are too late, and because of the bad numbers they likely should have been cutting in June, if we believe the numbers. I believe by the 4th quarter, we are going to see a substantial acceleration.
Ha, ha. Bessent can’t decide if he should say the jobs numbers are right or if they are rigged. He tries to have it both ways. Trump says they were rigged and reason to fire McEntarfer, so Bessent can’t come out and say they were right. But if Bessent says that they are right, then Trump was was wrong about McEntarfer, but Trump was right about the Fed being wrong. Or something like that. He’s flailing.
Unfortunately no one asked Bessent about his claim that tariff taxes increase GDP, dollar for dollar.
And Reuters on the story about Trump’s mortgage attack dog Bill Pulte’s parents illegally claiming homestead property tax exemptions on two primary residences simultaneously in Michigan and Florida. These are expensive houses, $1 million in Michigan and $4.5 million in Florida. The homestead exemption in Florida alone saves them $125,000 in property taxes annually. This would be tax fraud.
You know what they say about Trump and his crowd — every accusation is a confession. They are so wrapped up in their own crimes that they assume everyone else is doing the same.
Ok, this is the meat of the claim:
“Using a real-time recession detection algorithm trained on a century of broader labour market data, Michaillat — who is also a research associate at the NBER — estimates a 71 per cent probability that the US economy was already in recession in May. ‘While the other NBER data might seem useful, the labour market reflects a more fundamental reality. Falling vacancies and rising unemployment are, in my view, a more reliable indicator of widespread economic distress,’ he says. Indeed, in July the number of job seekers exceeded the number of openings for the first time since 2021.”
This is the Beveridge curve model I have critiqued before, in part because openings are such a soft variable and gamed by companies (much moreso than back in the day when they actually had to pay for “help wanted” ads). So let me re-up my comment about it from July:
– the article refers to making use of 7 (iirc) series for job vacancies. I spent a little time trying to find these but was unable to. In any event, this raises the question of whether the model is, as the late Jeff Miller used to say, overdetermined. In particular, it gives a “just so” best result in the past that is upended by different conditions.
– and in particular, the “different conditions” in 2023-24 was the spike of perhaps 5-6 new immigrants looking for jobs. As I pointed out before, if 4 million of these found jobs, but 1 million didn’t, that would be consistent with an increasing unemployment rate (and a decreasing vacancy rate) but a still-expanding economy.
Could it turn out that March or April were the economic peak, after revisions? Of course. But there are a raft of short leading indicators which either haven’t turned down yet (initial claims, stock prices, business formations, real aggregate payrolls) or else just turned down in spring (e.g., residential construction jobs) that suggest early spring was not the peak.
P.S. I highly approve of re-basing your data series to earlier this year, rather than 2022. By now we all know that the economy grew since then!
New Deal Democrat: See guest post and associated paper here