See this clip, at 2:17. Over the longer term, the stock prices should equal the present discounted value of dividends, themselves relective of earnings and profits. That’s basic finance. That being said, there are over time substantial (apparent) deviations from the PDV of dividends (see Shiller, AER 1981), or big moves in the price-earnings ratio, defined in any way you want (12 month trailing, cyclically-adjusted, 1 year forward), as earnings fail to materialize, or the equity risk premium seemingly changes.
Overall, the cyclically adjusted price-earnings (CAPE) ratio is only slightly higher than the 2021M11 level, in the aggregate. On the other hand, the inflation protected 10 year yield is now a full 2.8 percentage points higher than then!
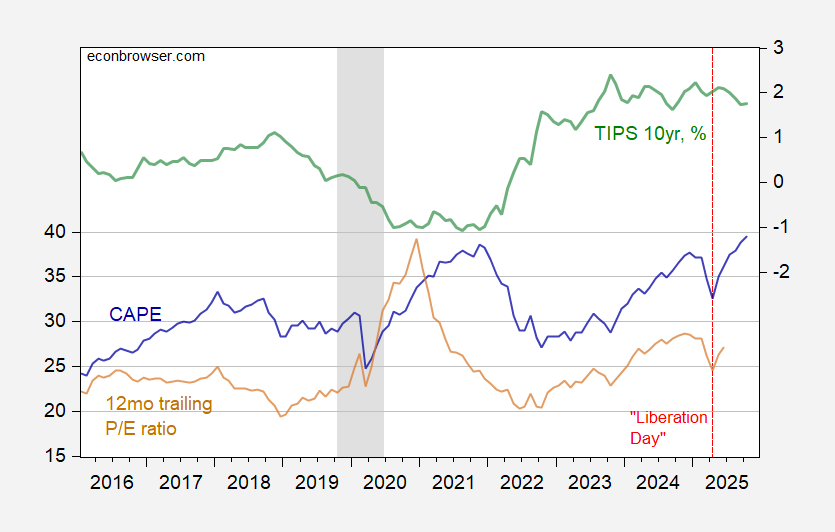
Figure 1: CAPE (blue, left scale), P/E ratio, 12 mo trailing earnings (tan, left scale), and TIPS 10 yr yield, % (green, right scale). NBER defined peak-to-trough recession dates shaded gray. Source: Shiller, Treasury via FRED, NBER, and author’s calculations.
Here are the price-earnings ratios for the Magnificent-7 vs. S&P500 ex-Mag 7.
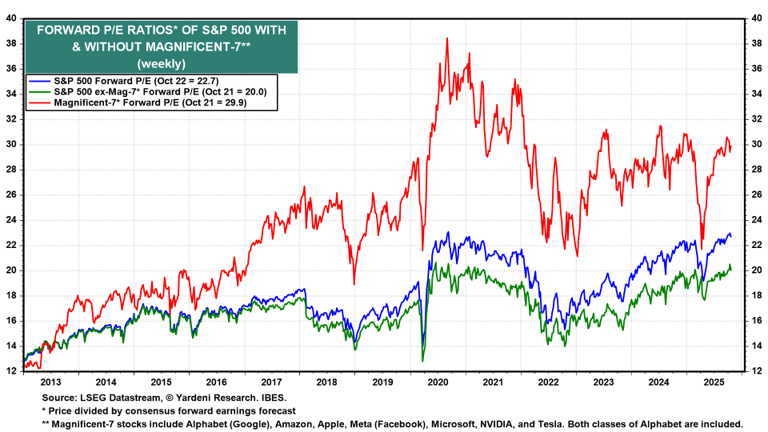
Source: Yardeni.com.
Does it matter that this particular sector seems, to me at least, potentially overvalued given current real interest rates? Well, perhaps, as current capitalization of Mag-7 is 35.9% of the S&P500.
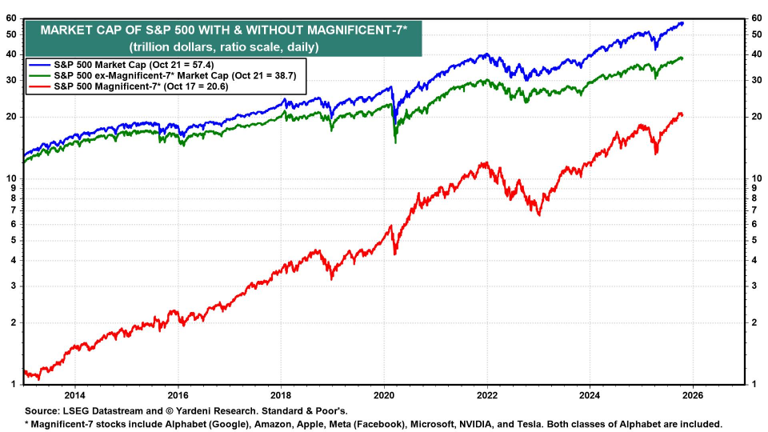
Source: Yardeni.com.
So time will tell. Personally, I thing the purportedly pro-growth policies (financial deregulation, dilution of capital requirements) alluded to will increase a likelihood of a “discontinuous change” in asset prices (recall, the 2008 financial crisis followed a period of financial regulatory disarmament, as discussed here).
Tangentially on topic – regional bank shares have uunderperformed the overall stock market and large bank shares for the past month or so – take a look at the ^KRX index or the KRE exchange-traded fund for evidence.
Two stories are told to account for the poor performance of regional bank shares. One is that regional banks are heavily exposed to commercial real estate loans; true, but not new. The other is that recent episodes of bad bad credit and fraudulent loan documentation are seen as evidence of endemic weak lending standards, as opposed to one-off events. Late-cycle is when relaxed lending standards typically start to cause trouble – higher late-cycle interest rates combine with slower growth and an accumulation of bad lending decisions to generate big loan losses. A look at the broadest index of lending standards I can find in the Fed’s Senior Lending Officer Survey suggests we already went through the bad times:
https://fred.stlouisfed.org/series/SUBLPDMOSXWBNQ
Indices representing collateral requirements, size of credit lined and the like all show a similar pattern of conservatism in this cycle, with lending conditions actually relaxing to around neutral recently. That index doesn’t tease regional banks out for comparison to the big banks, so it’s not as informative as I’d like. It also says nothing about the state of non-bank lending, which is a big worry these days. We also need to keep in mind that auto loan and credit card default rates are up.
To Menzie’s point about the perpetual right-wingnut demand for reduced oversight of the financial sector, all I would add is that the shift toward non-bank lending means that financial oversight is already quite low. What do these guys want? The answer is probably “whatever our financial masters tell us to want”.
By the way, we’re engaging jn an interesting natural experiment in the benefits of financial refulation and oversight. Fed survey data show bank lending standards have been fairly tight in this cycle, while lightly regulated non-bank lenders have gained substantial market share in lending relative to banks. Let’s see who is standing closest when the @^>/ hits the fan this cycle. Banks have some pretty big exposure to non-bank lenders, which means we need to keep an eye on the sequence of events – which dominos fall first?
I absolutely agree with Menzie’s skepticism of the MAG7’s market cap and prominence in the US economy… Now we’re doubling down, assigning vast sums of credit to IC fabrication, AI data center and associated electrical utility expansion. Much of these liabilities get assigned through securitization to opaque private credit vehicles with collateral insufficient to cover failure.
Unadjusted for inflation….
Over the period 1980-2025, the US “market cap” (https://fred.stlouisfed.org/series/BOGZ1LM893064105Q) expanded at an average annual rate of 10.3%.
Over the same period, the US GDP (https://fred.stlouisfed.org/series/GDP) expanded by an average annual rate of 5.45%
Since credit is essentially indistinguishable from currency in our modern economy, we should conclude that there has been at least (10.3-5.45=) 4.85% per year financial inflation in the USA over the last 45 years…
Compare that with the 3.09% per year CPI averaged over the same period.
Bottom line: The credit market cap is inflating at least (4.85-3.09=) 1.76% per year faster than prices for goods and services are. Credit values over this 45 year period are now 219% higher than the actual assets adjusted for inflation!
$100T market cap?
Time for a reckoning ?