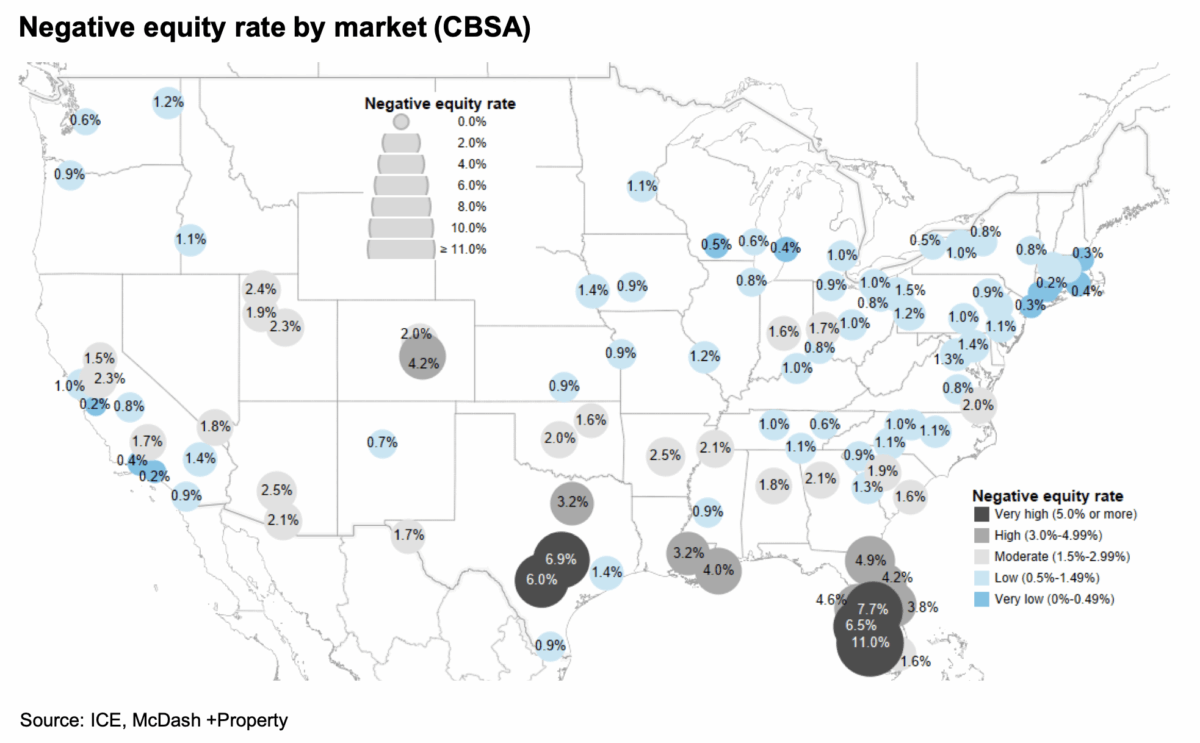
I’m teaching a course entitled “The Financial System”, and as part of revising the course, I’m looking at trouble spots. Bill McBride at CR posted this interesting map:
House prices have been declining since early 2025; contra Bessent, high interest rates are not strongly correlated with real rates (but are more correlated with high measured policy uncertainty).
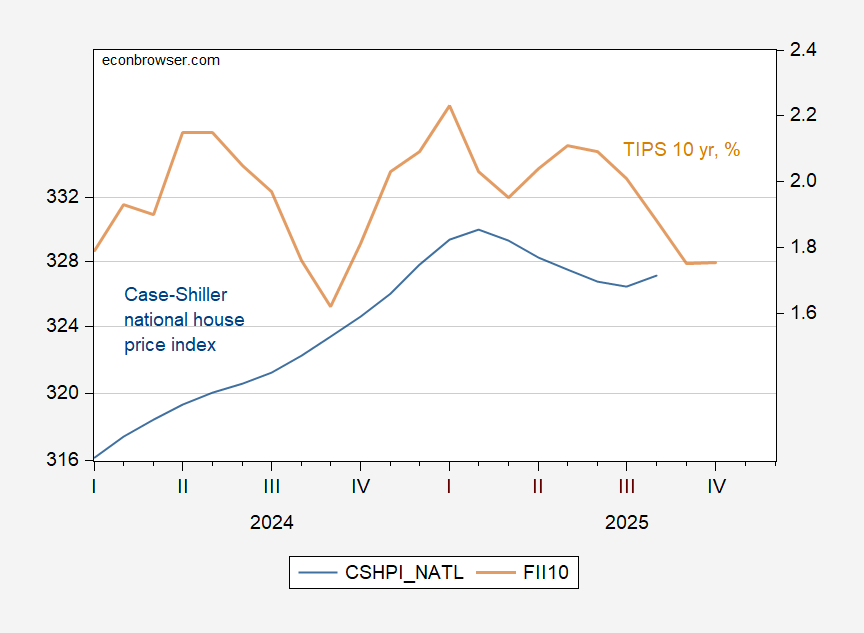
Figure 1: Case-Shiller National House Price Index (blue, left log scale), TIPS 10yr, % (tan, right scale). Source: S&P, Treasury via FRED.
Contrast with EPU:
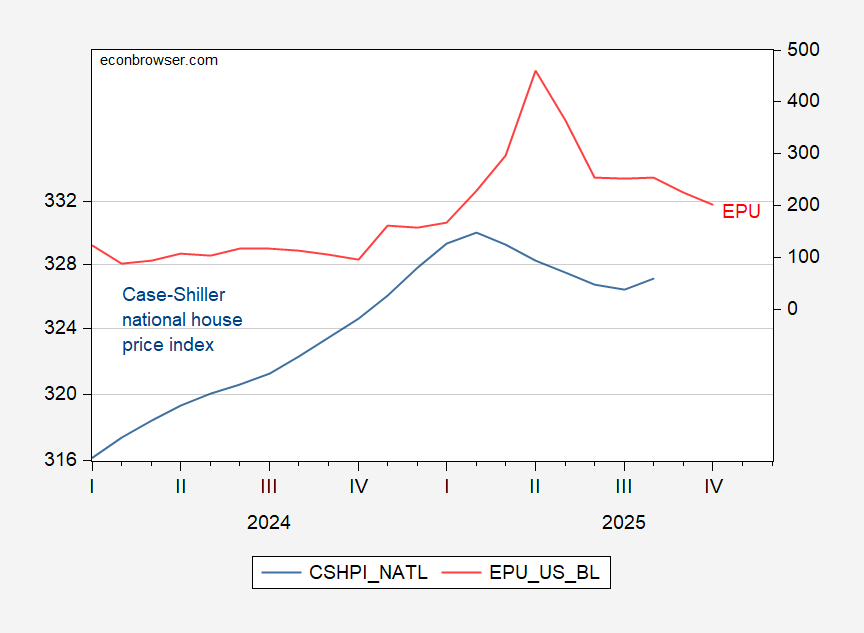
Figure 2: Case-Shiller National House Price Index (blue, left log scale), Economic Policy Uncertainty, legacy version (red, right scale). Source: S&P, policyuncertainty.com via FRED.
As CR notes:
While overall negative equity rates remain low, certain markets are showing signs of concern, particularly in the Gulf Coast of Florida and Austin, Texas.
So, maybe I don’t need to panic yet…
Price follow sales (permits and starts), which in turn follow (the inverse of) mortgage rates:
https://fred.stlouisfed.org/graph/?g=1NOlu
Not a perfect correlation, but not rocket science either.
Permits and starts have been sucking wind (a technical term) since 2022, with a renewed pulse downward in the past year. In fact they have declined from peak by a percent which in the past has more often than not been recessionary.
That prices have followed is completely unsurprising.
How many do you think would have negative equity with Trump and Pulte’s new 50-year mortgages? It is effectively an interest-only loan for the first half. Even 30 years in they would have only paid 25% of the principal.