With a surprising outcome in GDP [Hamilton/Econbrowser] [Chinn/Econbrowser], recall that other indicators are relevant, particularly given the record of GDP revisions over time.
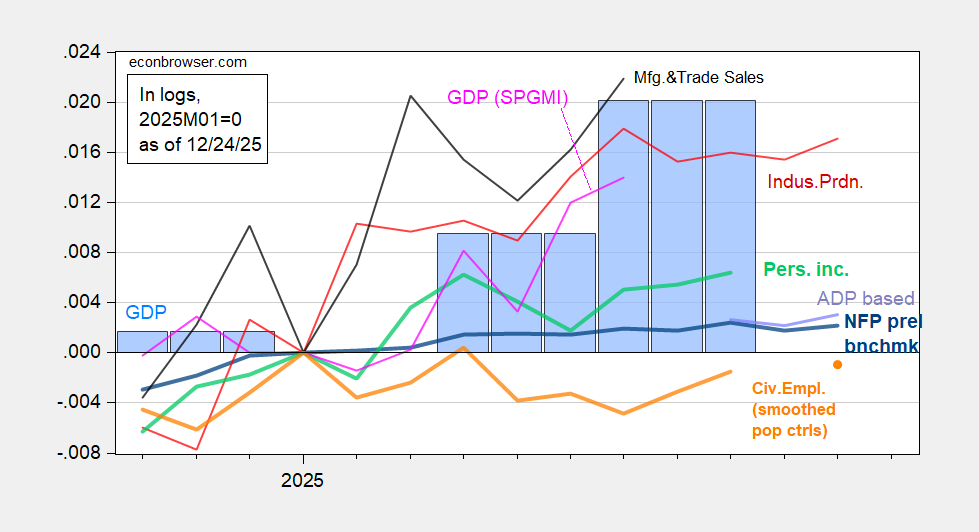
Figure 1: Nonfarm Payroll incl preliminary benchmark revision employment from CES (bold blue), implied NFP from ADP plus estimates for government employment (lilac), experimental civilian employment using smoothed population controls (orange), industrial production (red), personal income excluding current transfers in Ch.2017$ (bold light green), manufacturing and trade sales in Ch.2017$ (black), consumption in Ch.2017$ (light blue), and monthly GDP in Ch.2017$ (pink), GDP (blue bars), all log normalized to 2021M11=0. Source: BLS via FRED, Federal Reserve, BEA 2025Q3 initial release, S&P Global Market Insights (nee Macroeconomic Advisers, IHS Markit) (9/2/2025 release), and author’s calculations.
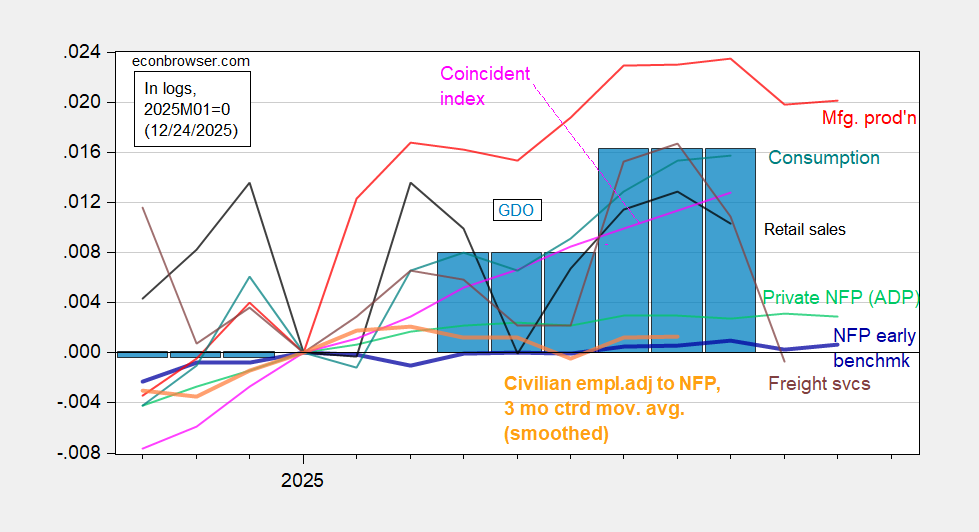
Figure 2: Implied Nonfarm Payroll early benchmark (NFP) (bold blue), civilian employment adjusted to NFP concept, smoothed population controls and 3 month centered moving average (bold orange), manufacturing production (red), personal income excluding current transfers in Ch.2017$ (bold green), real retail sales (black), freight services index (brown), and coincident index in Ch.2017$ (pink), GDO (blue bars), all log normalized to 2021M11=0. Source: Philadelphia Fed [1], Philadelphia Fed [2], Federal Reserve, BTS via FRED, BEA 2025Q3 initial release, and author’s calculations.
Note the vertical axes are the same in the two graphs; hence, the two graphs are comparable. Hence, GDO is only 1.6% above 2025Q1 levels, while GDP is 2.0%.
The graphs also highlight the divergence through Q3 of employment indicators (from CES and CPS) from output indicators (such as GDP and GDO).
Howard Lutnick: “The US economy grew 4.3%. What that means is that Americans overall — all of us — are going to earn 4.3% more money.”
That’s 4.3% real so with 2.7% inflation, we all are expecting 7% raises this year. Whoopee!
Hard to believe that this idiot ran an investment bank. Also, he is Commerce Secretary responsible for compiling and reporting GDP so …?
Move over John Taylor, there a new boss in the house. I quote Trump in full:
“THE TRUMP RULE: The Financial News today was great — GDP up 4.2% as opposed to the predicted 2.5% (and this, despite the downward pressure of the recent Democrat Shutdown!) — But in the Modern Market, when you have good news, the Market stays even, or goes down, because Wall Street’s “heads” are wired differently than they used to be. In the old days, when there was good news, the Market went up. Nowadays, when there is good news, the Market goes down, because everybody thinks that Interest Rates will be immediately lifted to take care of “potential” Inflation. That means that, essentially, we can never have a Great Market again, those Markets from the time when our Nation was building up, and becoming great. Strong Markets, even phenomenal Markets, don’t cause Inflation, stupidity does! I want my new Fed Chairman to lower Interest Rates if the Market is doing well, not destroy the Market for no reason whatsoever. I want to have a Market the likes of which we haven’t had in many decades, a Market that goes up on good news, and down on bad news, the way it should be, and the way it was. Inflation will take care of itself and, if it doesn’t, we can always raise Rates at the appropriate time — But the appropriate time is not to kill Rallies, which could lift our Nation by 10, 15, and even 20 GDP points in a year — and maybe even more than that! A Nation can never be Economically GREAT if “eggheads” are allowed to do everything within their power to destroy the upward slope. We are going to be encouraging the Good Market to get better, rather than make it impossible for it to do so. We are going to see numbers that are far more natural, and far better, than they have ever been before. We are going to, MAKE AMERICA GREAT AGAIN! The United States should be rewarded for SUCCESS, not brought down by it. Anybody that disagrees with me will never be the Fed Chairman!”
You’ve got to like the way he starts out: “GDP up 4.2% as opposed to the predicted 2.5% (and this, despite the downward pressure of the recent Democrat Shutdown!)”.
Q3 GDP “despite the government shutdown!” Does he even have a calendar or know how to read it? He does know how to recognize a giraffe as he has pointed out many times in his cognitive tests.
Let’s diagnose the source of the felon-in-chief’s mental deterioration, based on his doctors’ choice of diagnostic tests:
Cognitive tests + MRI = White Matter Disease
White matter disease is lesions in the white matter of the brain caused by reduced blood flow. It is common after the age of 60. If the progression of white matter disease isn’t checked, it can lead to dementia and to a loss of emotional regulation. The test for white matter disease is an MRI.
The felon-in-chief has admitted to suffering chronic venous insufficiency, a weakening of the valves in veins resulting in pooling of blood in the legs. There is evidence that white matter disease is more associated with venous than with arterial failure:
https://www.sciencedirect.com/science/article/abs/pii/S030698772033348X
As a wild guess, the felon’s weak veins could extend beyond his legs and be causing lesions in his white matter.
Obesity is a contributing factor in venous insufficiency. Obesity doesn’t discriminate; it is associated with both grey and white matter damage in the brain. So obesity isn’t necessarily evidence for white matter disease, but it doesn’t help.
Starting out as an underdeveloped and under intelligent spoiled brat has not helped his mental development and may have enhanced his decline. He never learned to think, because he never had to.
Let’s diagnose the source of the felon-in-chief’s mental deterioration, based on his doctors’ choice of diagnostic tests:
Cognitive tests + MRI = White Matter Disease
White matter disease is lesions in the white matter of the brain caused by reduced blood flow. It is common after the age of 60. If the progression of white matter disease isn’t checked, it can lead to dementia and to a loss of emotional regulation. The test for white matter disease is an MRI.
The felon-in-chief has admitted to suffering chronic venous insufficiency, a weakening of the valves in veins resulting in pooling of blood in the legs. There is evidence that white matter disease is more associated with venous than with arterial failure:
https://www.sciencedirect.com/science/article/abs/pii/S030698772033348X
The felon’s weak veins could extend beyond his legs and be causing lesions in his white matter.
Obesity is a contributing factor in venous insufficiency. Obesity doesn’t discriminate; it is associated with both grey and white matter damage in the brain. So obesity isn’t necessarily evidence for white matter disease, but it doesn’t help.
With labor hours soft and output strong, labor productivity will jump. No farm business output rose at a 5.4% pace (SAAR) in Q3, while aggregate private hours worked were dead flat. That makes for a 5.4% gain in productivity, give or take. In the era of the Great Moderation, a 5.4% pace of productivity gain has been seen outside of recession and early recovery only during the Y2K boom:
https://fred.stlouisfed.org/graph/?g=1P9i8
Which leaves us with one oftwo history-based conclusions. Either we’re in the middle of a tech boom (we are) which may end in a tech bust, or we’re turning recessionary.
Real disposable income was also flat in Q3, not a surprise when labor hours are flat. Does that fit better with a tech boom or recession?:
https://fred.stlouisfed.org/graph/?g=1P9iJ
Well, we only have that one example of a tech boom during thr Great Moderation, but during that boom, real disposable income growth was quite strong in all but one quarter. What we know about that period is that income growth drove demand, right alongside investment in tech and gains in wealth; Clinton was lucky in his timing.
The tech boom is producing high profits for firms like Nvidea. Whether that’s sustainable is very much a question of the coming year, but not the only one. Does weak household income growth mean weak trend growth, no matter the benefits (or not) of AI? Personal spending accounts for 68% of GDP over the past year.
Merry Christmas, y’all.
Based on the volume of presents at my sister’s house today I have more confidence in the recent GDP numbers. Granted, not a big data set, but consumption patterns were robust and show expansion relative to prior holidays.
Bigger data set:
https://tradingeconomics.com/united-states/redbook-index
More or less the same story as at your sister’s house. The Redbook is same-store, nominal sales growth, so not quite what we want, but weekly, so quite current.
Trump: “I want to have a Market the likes of which we haven’t had in many decades, a Market that goes up on good news, and down on bad news, the way it should be, and the way it was. Inflation will take care of itself and, if it doesn’t, we can always raise Rates at the appropriate time — But the appropriate time is not to kill Rallies, which could lift our Nation by 10, 15, and even 20 GDP points in a year — and maybe even more than that!”
Growth of 20 GDP points in a year — maybe even more than that. Hey, if he can reduce drug prices by 1,000%, why not?
Interesting the way he equates the stock market with GDP. There’s nobody in the White House to tell him the difference. And he is going to put in a Fed Chairman that goes along with all this insanity without even blinking.
Heck, everybody’s doing it,, so…as the year draws to a close:
DXY down 9.65% so far this year
bitcoin down roughly 8.6%
S&P500 up 18.1%
Gold up 72%
Silver up 173%
Fed funds rate down 75 basis points
10-year Treasury yield down 40 bps
PCE Deflator up 7 bps
CPI up 13 bps
Real disposable income up 1.9% y/y vs 2.2% at the end of 2024
U. Michigan consumer sentiment index down down 23 points
U. Michigan inflation expectations up 1.7 ppt, at 4.5% vs 2.8% in December, 2024.