Following up on Jim’s post yesterday, here are some additional thoughts on the “initial” (consolidated advance and 2nd) release: (1) GDP far exceeds nowcasts, (2) potentially more momentum-relevant “core GDP” advances strongly, but much less so than GDP, and (3) alternative estimates of economic activity like GDO suggest slower growth.
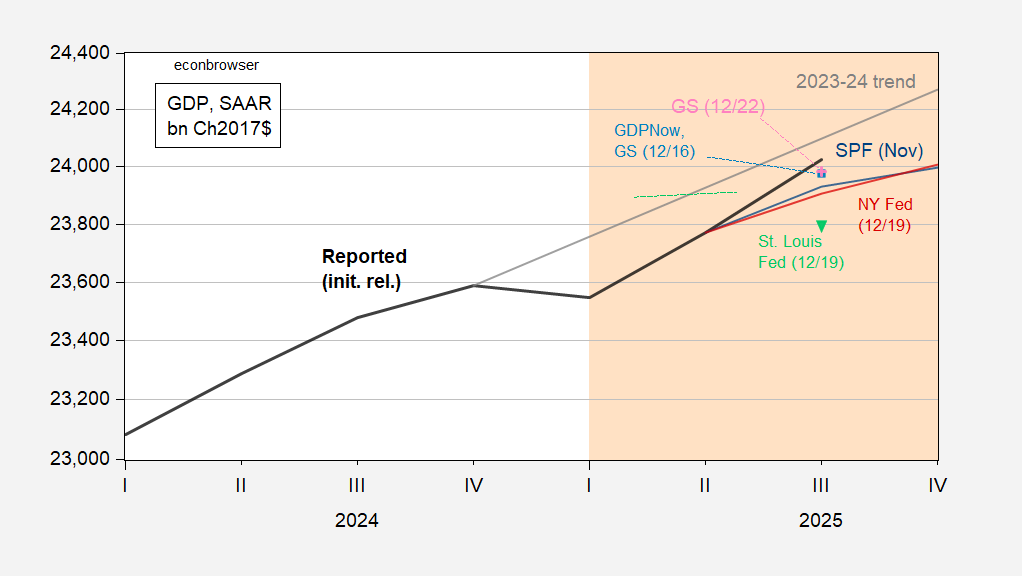
Figure 1: GDP (bold black), GDPNow (light blue square), NY Fed (red line), St. Louis Fed (inverted light green triangle), GS tracking (pink +), November Survey of Professional Forecasters (blue), 2023-24 stochastic trend (gray), all in bn.Ch.2017$ SAAR. Source: BEA, Atlanta Fed, NY Fed, St. Louis Fed via FRED, GS, Philadelphia Fed, and author’s calculations.
Notice that despite the big upside surprise (4.3% vs. 3.3% Bloomberg consensus), GDP is still not back to the 2023-24 trend.
Jason Furman, and others, have stressed “core GDP” growth as a better measure of momentum in aggregate demand from the private sector. Here, we see that while the outcome was higher than GDPNow implied, it’s still below the levels from the November Survey of Professional Forecasters (and much below the 2023-24 trend).
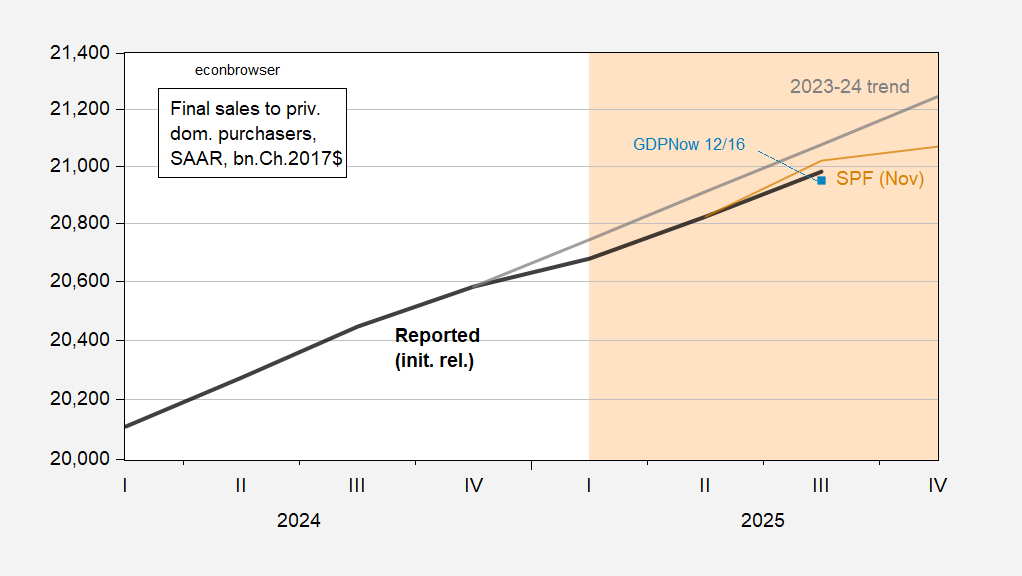
Figure 2: Final sales to private domestic purchasers aka “core GDP” (bold black), GDPNow (light blue square), November Survey of Professional Forecasters (blue), 2023-24 stochastic trend (gray), all in bn.Ch.2017$ SAAR. Source: BEA, Atlanta Fed, Philadelphia Fed, and author’s calculations.
Finally, in these times of disruptions to the data collection and and methods, it pays to see what other indicators suggest about growth. GDP grew faster than GDO (and GDP+) in Q4: 4.3% vs. 3.4% vs. 2.6%.
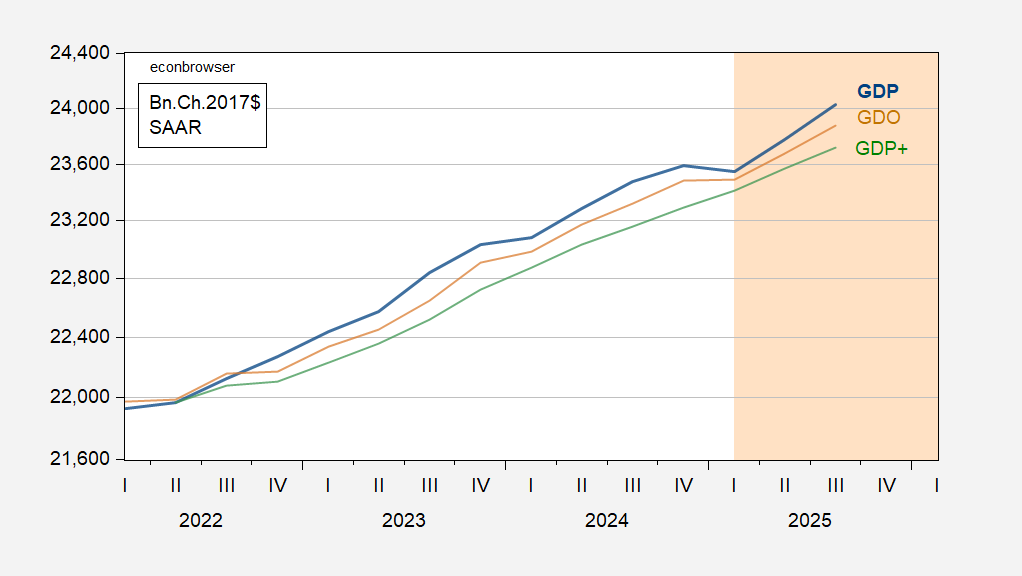
Figure 3: GDP (bold black), GDO (tan), GDP+ (green), all in bn.Ch.2017$ SAAR. Level of GDP+ calculated by iterating on 2022Q2 GDP using GDP+ growth rates. Source: BEA, Philadelphia Fed, and author’s calculations.
Today’s Industrial Production data for November shows factory output down in the first two months of Q4 relative to Q3. Overall industrial is up slightly so far in Q4, helped by a pickup in mining. IP for October was revised lower. All in, looks like manufacturing is going to be a drag on Q4 GDP.
maybe even look at the annual rate of 2.3%