Unsurprisingly, the former leads the latter, but the lag is (highly) variable.
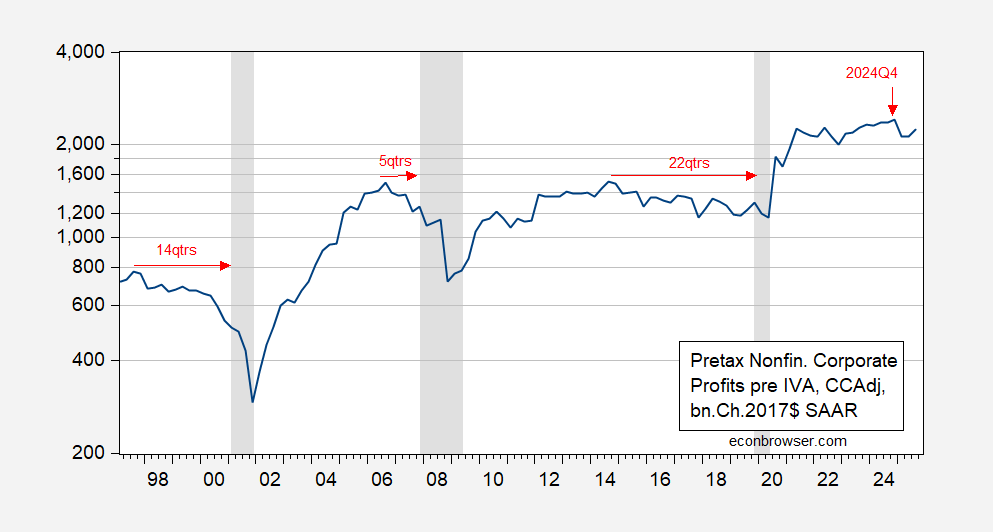
Figure 1: Real pretax corporate profits for nonfinancial firms, bn.Ch.2017$ SAAR (blue). Deflated by personal consumption expenditure deflator. Red arrows denote time from peak profit to NBER peak. NBER defined peak-to-trough recession dates shaded gray. Source: BEA, NBER, and author’s calculations.
Hence, while nonfinancial corporate profits have (apparently) peaked, it’s not clear this signals an imminent recession. And indeed, considering there might not have been a recession were it not for the Covid-19 pandemic, the lag length seems so variable so that corporate profit peaks are of little use.
The lag length is certainly variable, but as per your graph, it is typically at least 1 year before a recession.
Here is a longer term look:
https://fred.stlouisfed.org/graph/?g=1PnnO
No indicator is perfect, but if corporate profits have not peaked, it is more likely than not that you have at least 1 year to go before the next recession. When looked at in conjunction with other such “long leading” indicators, e.g., housing permits, they have a pretty decent record.
Once the majority of long leading indicators have turned down, then you look for indicators with a shorter lag time, e.g., jobless claims and the stock market, to see if they confirm.
And elswhere in the world:
https://www.ft.com/content/2a69ff03-5ead-4818-a5f8-2fb5f6f41e1b
“China’s industrial profits plunge as weak demand and deflation bite”
Recent data out of China have been ominously bad.
Professor Chinn,
If I am using Professor Hamilton’s cycle model, it looks like corporate profits peaked at 2022Q2.
Professor Chinn,
I meant to say if I am using Professor Hamilton’s cycle model properly.