GDP growth of 4.3% far exceeded the 3.3% consensus forecast. However, as a survivor of the 2001 “is it or not” recession debate*, I think it useful to consider the revisions that occur to GDP growth. Here’s a picture of levels of GDP for 2001, according to different vintages.

Figure 1: GDP in billions Ch. 1996$ SAAR. NBER defined peak and trough dates at dashed lines. 6/29/22 GDP calculated dividing nominal GDP by GDP deflator rescaled to 1996=100. Source: BEA via ALFRED, NBER, and author’s calculations.
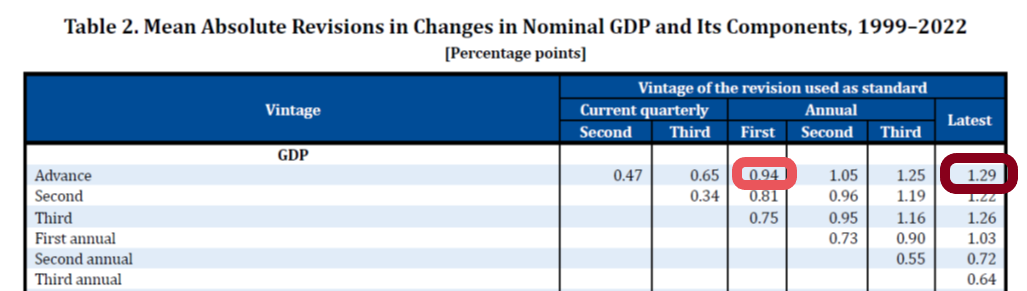
While the mean revisions are typically close to zero, the mean absolute revisions from advance to third release are typically substantial, on the order of 0.65 ppts, and from advance to first annual revision at 0.94 ppts, and to latest about 1.29 ppts (red and brown boxes in Table 2 from BEA (2024) excerpt below).
Source: BEA (2024).
In other words, it would not be statistically implausible for GDP growth to range between 3-5.6 ppts by the third release, and eventually 1.7-6.9 ppts (all figures annualized).
This is why in dating recessions, the NBER’s Business Cycle Dating Committee relies more on monthly indicators, and in particular employment and personal income ex-transfers, rather than on GDP. For a graphical depiction of these monthly indicators, see this post.
Here’s a question about GDP. BEA says that personal consumption expenditures are about 70% of GDP, $20 trillion. BEA says there are about 135 million households, so GDP personal consumption would average $148,000 per household.
The BLS says that average household spending is $79,000. How do I reconcile the difference between $148K and $79K? And $148K is way more than average household income. I realize that PCE and CPI are different, but that different?
I must be missing something very obvious in the difference between what GDP is measuring and BLS is measuring.
Mean v. median?
They are both averages, mean, so division by the number of households is appropriate. The difference between $148K in BEA/PCE and $79K in BLS/CPI is $69K, a not insignificant difference.
I found part of the difference. PCE includes the employer portion of health insurance as consumer spending as well as Medicare and Medicaid. CPI expenditures count only personal out of pocket spending. This accounts for about $20K of the difference.
PCE also includes spending by non-profits on behalf of households. This accounts for another $5K of the difference.
That still leave another $44K of consumer spending in the PCE I haven’t figured out yet. I suspect it has to do with other government spending like SNAP that goes to households.
I think this is important because economists are fond of saying that consumer spending is 70% of GDP. It seems important to understand exactly what that means. It is most definitely not out of pocket spending. In fact 45% is not.
When economists say that that the 70% consumer spending is propping up the economy, out of pocket spending by consumers is only about a third of GDP. Seems this is an important distinction.
Gimme the BLS link and I’ll have a look.
You’re BEA math is right:
https://fred.stlouisfed.org/graph/?g=1Pwvm
Seems like a definitional issue, as you suggest.
BEA is here: https://www.bea.gov/sites/default/files/2025-12/gdp3q25-ini.pdf
BLS is here: https://www.bls.gov/news.release/cesan.nr0.htm
One complication is that BLS is in household average and BEA is in aggregate numbers, so you have to either multiply BLS by 135,000 households or divide BEA by 135,000 households to compare the two.
And there aren’t all line by line identical items. I’m pretty sure that the differences are government spending going to households but I just haven’t identified it all other than the big obvious one, healthcare.
I do think its important to note that when economists talk about consumer spending being 70% of GDP, only about a third of GDP is out of pocket spending. The rest is government transfers.
Uh, 135 million, that is.
I got nothin’. Dividing BEA’s PCE number by the number of households gets average household spending roughly equal to household spending for the top quintile in the BLS document. And the BEA number you and I are both calculating is obviously wrong. Has to be; the average household is not spending $150k per year. I thought maybe the denominator might be the problem, but “consumer units” and “households” seem to be the same thing, or at least close enough.
By the way, same problem with income. Divide personal income by number of households and you get average income of around $188k, vs an official median income of around $88k. So dividing personal income or spending by number of households is clearly the wrong thing to do, but I don’t know why.
Good catch. Wish I knew what the problem is, but I don’t.
I don’t think there is anything nefarious about it. It’s just that the BEA counts everything spent on behalf of personal consumers while BLS counts only out of pocket spending.
A good example is medical care, where the BEA counts employer spending on insurance premiums, Medicare and Medicaid. That’s accounts for about $20K of the difference per household. I suspect SNAP benefits would be another.
It all suggests that some 45% of personal consumption is indirect, which is an important thing to realize when talking about GDP. And when economists say that discretionary consumer spending is propping up GDP, it is coming from a much narrower segment then generally recognized.
Also noticed that Q3 2007 originally listed GDP growth at 4.9%, and has since been revised to 2.5%. I will add that the numbers on the late 2025 economy and sentiment sure match late 2007-early 2008 in many areas.
Just sayin’…