Downshift in TX. These three states account for about 27% of national NFP employment, and about 1/3 of US GDP.
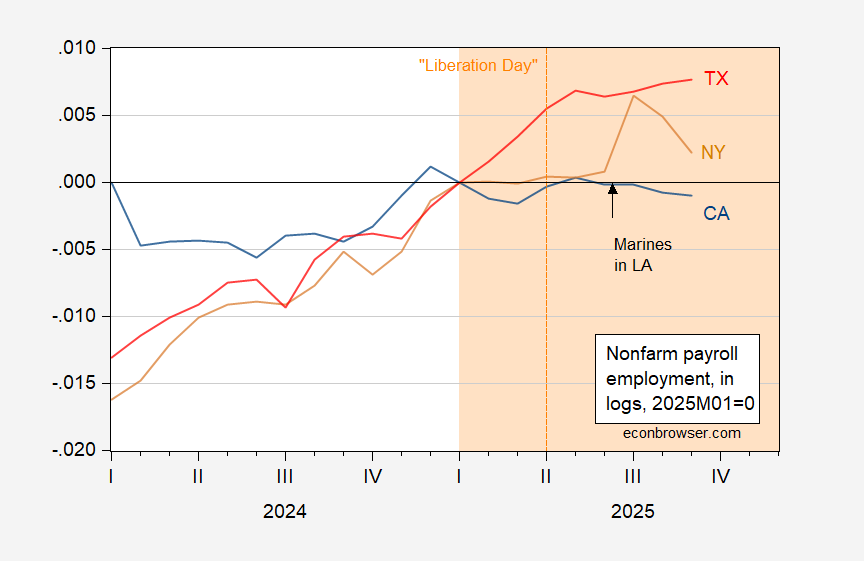
Figure 1: Nonfarm payroll employment in CA (blue), NY (tan), and TX (red), all s.a., in logs, 2025M01=0. Source: BLS, and author’s calculations.
“According to a list of “Cali-Formers,” companies compiled by the Sacramento-based Center for Jobs and the Economy, since 2020 over 500 companies have either left California completely, or opted to expand their operations in a different state while shrinking their operations here. The list includes scores of household name companies: Aerojet, Aligent, AirBNB, Alphabet (Google), Amazon, Amgen, and Apple, and that’s just the As. It spans the gamut from high-tech and aerospace, to energy (Chevron) and civil engineering (Bechtel), to arts and entertainment (Academy of Country Music, Disney). When including companies that have simply downsized their presence in California, opting to expand in other states instead, it’s a challenge merely to find a large company that wouldn’t be on this list.”
https://californiapolicycenter.org/reports/worsttobest/
“Florida and Texas, which have both been among the fastest-growing states in the nation for years, know what a positive impact a booming population can have on the local economy and job market, as well as what happens when this demographic explosion starts to wane.
This year’s State of the Nation’s Housing report, released earlier this week by the Joint Center for Housing Studies (JCHS) of Harvard University, found that the movement of Americans across the country has declined in 2024 all across the country, including in the states that are traditionally the most popular among movers.”
https://www.newsweek.com/states-where-americans-moving-map-2090494 [See interactive map for data for each state. California and New York showed largest net losses.]
Texas has see rapid growth in the high tech sector, including some from California companies relocating.
https://texastoday.com/tech-industry-expansion-in-texas-a-booming-sector-fuels-growth/
https://www.techtimes.com/articles/311513/20250728/chevron-tesla-oracle-lead-wave-companies-leaving-california-2025-over-high-costs-regulations.htm
Florida has seen rapid growth of the financial sector, including some from New York companies relocating.
https://nywire.com/nyc-wealth-exodus-mamdani-effect-tax-hike-fears-and-the-florida-migration-spike/
https://www.forbes.com/sites/jackkelly/2023/08/23/wall-street-is-going-south-and-taking-1-trillion-in-assets-with-it/
What’s the common denominator that is propelling these changes? Really two things:
1. the business environment
2. the state tax structure
Those are negatives for California and New York while they are positives for Texas and Florida.
Brucie has once again found a single factoid that makes him happy. Texas, or the pi ies of the state government of Texas, suit Brucie, so he links to articlesthat flatter Texas, and by extension flatter Brucie. What other factors might we want to consider before declaring Texas the best of all possible states?
BLS reports the average weekly wage California as of August was $1,364. In Texas, it was $1,244, so 8.8% lower than in California. If you want to work for less, by all means work in Texas.
Why would pay be higher in California? Theory sugtests it’s because Californians are more productive. California’s output per capita in 2024 was $104,916. Texas, $86,987. So, yeah, workers in California are more productive. So if you want to be less productive and earn less because of it, move to Texas.
How about food assistance? Does the thriving Texas assure that its population is better fed? No. No, it doesn’t. As of 2023, the most recent data I could find, 11.4% of Texas households received food assistance, same as in California. Educational attainment? Thirty-six percent of adult Californians have at least a Bachelor’s degree, vs 33% for Texas. Texas is near the middle of that heap, California just below the top third. By the way, Republican-dominated states fill the lower ranks of state educational attainment.
Life expectancy? California’s average as of 2021 was 78.3 years, topping the national average of 76.4 years. Texas residents can expect to live just 75.4 years.
So let’s all look to Texas as an example of how a good state is run. People in Texas produce less, earn less, are less well educated and die earlier than in that nasty hell-hole, California. Good thing businesses are flocking there.
many tech companies who moved to texas are having second thoughts, and moving again. why you ask? for one, texas is not as cheap as they thought. and second, they do not have access to the tech workers they need. and looking into the future, many tech companies see the texas government operating in ways that will not help that effort. public universities in texas are seeing an exodus of tech faculty, who can easily get safer jobs in other states. this is a big problem for texas and the tech sector. a technology economy can only operate if you have very robust university operations in that field. fresh graduates are mandatory for tech.
Bruce, some additional republican states are Mississippi, Louisiana and West Virginia. Why aren”t people beating down the doors to move there? Hint: its weather and beaches that help Florida and Texas, not business and taxes. I know from experience.
Hint: your assumptions don’t hold water… oceanfront or not.
https://worldpopulationreview.com/state-rankings/tax-burden-by-state
Brucie has been cryptic in his response, and for good reason. He is merely repeating himself, without responding to any of my points. He mentions “assumptions”, but other than assuming that wages, productivity, life span and hunger are important issues, I haven’t made any assumptions. Brucie is pretending that I have, because that’s how he argues when cornered.
On topic, for once:
Ahead of this week’s belated jobs data, here’s a thought about the composition of employment gains so far this year. One explanation commonly offered for the hiring drought is that immigration enforcement has shrunk the pool of available workers, and that the economy might be generating a bunch more jobs if not for that. Turns out, healthcare generated slightly more than all of the payroll jobs reported for Q3 of this year:
https://fred.stlouisfed.org/graph/?g=1OQVk
Before getting on to the point about immigration, I’d just point out that this is a pretty narrow base for employment growth. While some other sectors are adding jobs, employment outside of healthcare shrank in Q3 – revisions may change that, of course. Anyhow, I’m curious to see if October and November data change this picture.
I’ve charted quarterly changes to make the point clearer. Switch to monthly data if you’d like.
On to immigration…
I’ve seen estimates for the share of non-citizen workers in healthcare from 5% to 20% – not helpful, so please chip in if you have a reliable source. Anyhow, healthcare hiring, while slowing, has held up better than hiring in general, and is at least somewhat reliant on immigrants.
Here’s the same picture with construction employment:
https://fred.stlouisfed.org/graph/?g=1OQWX
Immigrant workers are estimated to hold about a quarter of construction jobs, and well above half in some locales and some specialties. This chart makes a clearer case for immigration enforcement putting a dent in hiring. By the way, since BLS reports non-farm employment, we’re missing an interesting data series.
Now, here are quarterly changes in finance and business services, where I wouldn’t expect a sudden decline in the availability of either undocumented workers or of imports to be the proximate cause of hiring weakness:
https://fred.stlouisfed.org/graph/?g=1OQVY
This is bad. Both of these sectors are shedding jobs. Something other than a shortage of immigrants seems to be at work.
Finally, here’s a comparison of healthcare and business services hire rates:
https://fred.stlouisfed.org/graph/?g=1OQY9
Healthcare is historically relatively high, business services relatively low. So again, something other than a shortage of immigrant workers is afoot. The hiring slowdown is widespread and not limited to sectors which hire lots of immigrants.
And again, this narrow base of hiring looks precarious. What would happen to aggregate ecinomic activity if, for instance, a whole bunch of people could no longer afford healthcare? Not that anything like that could happen.
https://fred.stlouisfed.org/graph/?g=1OQY9
The level of professional hires is relatively flat from Q3 2023 to Q3 2025; the level of healthcare hires has returned to pre-COVID levels after a COVID epidemic hiring surge.
https://fred.stlouisfed.org/graph/?g=1OQVY
Not significantly different from Q3 2023
https://fred.stlouisfed.org/graph/?g=1OQWX
A decline since Q3 2023; lack of cheap/exploited labor?
https://fred.stlouisfed.org/graph/?g=1OQVk
Healthcare commented on above; the “change” numbers for “Total Non-farm” do not seem to reflect the graph line.
https://fred.stlouisfed.org/series/LNU04073413
The employment/unemployment rates do not generally break out illegal immigrants directly, but the unemployment rate for native-born only shows a slight increase year over year.
Brucie, you seem to have misunderstood or misunterpreted every since chart. That, or you simply haven’t done a good job of conveying your point.
So, in a few simple sentences, what is your point?
pgl, you’re back! or a duck by any other name.
When you open the links, click on the 5Y buttons. The pictures become much clearer than an exaggerated one year vertical scale.
https://handsondataviz.org/how-to-lie-with-charts.html
Clearer? No. More to your liking, but no clearer.
As I made clear in my comment, my interest is in this year’s labor market performance. There has been a shift THIS YEAR to an ever greater share if employment growth coming from a single sector.
Nice try…well, not really.
Krugman links today to an article in Foreign Affairs entitled “The Price of American Authoritarianism” by Steven Levitsky, Daniel Ziblatt and Lucan Way:
https://www.foreignaffairs.com/united-states/american-authoritarianism-levitsky-way-ziblatt
Levitsky and Zablatt have previously argued that the U.S. is descending into “competitive authoritarianism”, under which government turns authoritarian while maintaining a sham of democracy. This new article argues that this year, the U.S. has moved faster toward competitive authoritarianism than did Chavez’s Venezuela, Erdogan’s Turkey, Orban’s Hungary, or Modi’s India in each man’s first year in power. This is, of course, not the felon-in-chief’s first year in power. It’s just the first year he has been in power since his failed coup.
Anyhow, so much for our vaunted institutions. Four years in the indictment wilderness was all the felon needed to learn the lessons of Orban, Erdogan, Modi and Chavez, and those lessons apparently work just fine here.
Except, of course, that each of those men oversaw real economic gains for there rank-and-file supporters early in their tenures in office. Trump has failed to do so. We’re gonna find out how much that matters.
One could argue that this so-called “competitive authoritarianism” began, in earnest, during the Biden Administration.
The Democrats used both Federal and State judicial systems to try to take down Trump. It backfired.
One could argue any silly thing one wants, and you often do.
The argument you’re making here is a common one from right-wing hacks, and is taken right from the Soviet Union’s Cold War play book. It’s a “moral equivalence” argument. Never mind whether the felon-in-chief actually broke numerous laws both in and out of office. All that matters is that he was prosecuted, so now prosecuting others is fair, no matter what. The Soviets argued that everybody in their gulags had a trial – sometimes many trials – so their justice system was the moral equivalent of ours. All nice and tidy.
To save you the effort of having to scroll, here’s the same link I provided elsewhere, in which the felon’s own chief of staff says he has used the Department of Justice to persecute his polotical political opponents:
https://www.nytimes.com/2025/12/16/us/politics/trump-susie-wiles.html?smid=nytcore-ios-share
Find a similar accusation against Biden from someplace other than a right-wing propaganda mill. I dare ya.
Good of you to show your actual ethical standards, Brucie, not that there has ever been much doubt.
wrong on so many levels. trump is a criminal, and his indictments, trials and eventual guilty verdicts were simply the outcome of a rule of law process. I would rather not have to prosecute an ex-president. as an example, while he is trying to claim mortgage fraud against some folks on the fed, trump is guilty of exactly the same thing from his mortgages from the 90’s. he bought multiple properties as primary residences, and within weeks of purchasing, he turned around and rented those properties out. this is mortgage fraud, bruce. just like he has claimed against others. why is trump not being investigated and prosecuted, bruce? he is above the law?
Funny, I don’t recall Biden attempting a coup when he lost:
https://www.nbcnews.com/politics/justice-department/jack-smith-tells-congress-prove-trump-engaged-criminal-scheme-overturn-rcna249715
No big surprises in the jobs report. A disappointment, but not a surprise.
For what it’s worth, the Sahm rule is on the rise again:
https://fred.stlouisfed.org/graph/?g=1OSjl
Big question is whether Sahm’s rule has its mojo back.
Another gun shooting, this time at Brown. But no action taken by republicans to solve the problem. Other than buy more guns. Interesting how republicans made cleveland a gun free zone during their convention in cleveland 2016.
Looks like Susie Trump may have an eye on history, and wants to help draft the part about her role in it:
https://www.nytimes.com/2025/12/16/us/politics/trump-susie-wiles.html?smid=nytcore-ios-share
The felon-in-chief has an “alcoholic personality”, Bondi “completely whiffed” the Epstein files, Vought is a “right-wing absolute zealot”, Vance has been “a conspiracy theorist for a decade” and so on.
There’s always somebody who forgets to not tell the truth.
interestingly, she also make a point to say she is not an enabler. seems to be some whitewashing going on here, although I am surprised folks think they can make these types of comments without ramifications. knives are out I am sure.
The jobless rate among blacks hit 8.3% in November, up from 7.5% in September and 6.4% a year earlier. Here’s the picture, but without the big jump in November, presumably because FRED is having trouble with the missing data point for October:
https://fred.stlouisfed.org/series/LNS14000006
The low for black unemployment for this cycle was in April, 2023. That bottom in black unemployment is historically followed quickly by recession. Never has the black unemployment rate risen as much as it has since May outside of recession.
The jobless rate among those 16 to 19 years old rose to 13.4% in November from 11.1% in September and 12.4% a year ago. Here, too, such a sharp rise is typically associated with recession.
Lest you think somehow immigration enforcement is to blame and otherwise things would be jolly, the native-born jobless rate stood at 4.3% in November, up from 3.9% a year earlier. This series is too new to allow knowledge of recessionary signals. New population controls, due in January, may change the look of unemployment data, with special attention to new assumptions about non-native-born workers.