Just under two months ago, GDPNow’s estimate of the contribution of final sales to private domestic purchasers (sum of consumption and fixed investment) to GDP growth (q/q AR) was 2.84%, close to the Survey of Professional Forecasters’ median; now it’s 2.15%.
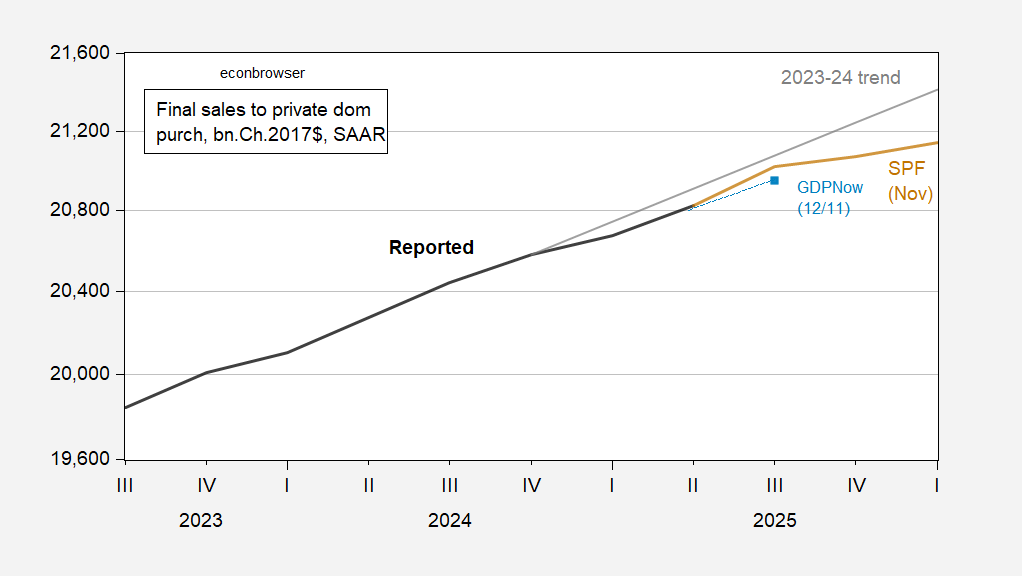
Figure 1: Final sales to private domestic purchasers (black), GDPNow nowcast (light blue square), November Survey of Professional Forecasters median (tan), 2023-24 stochastic trend (gray), all in bn.Ch.2017$ SAAR. Source: BEA, Atlanta Fed 12/11, Philadelphia Fed, and author’s calculations.
In September, the FOMC’s Summary of Economic Projections had real GDP growth next year at 1.8%, same as in March, up from 1.6% in June. This week, the FOMC’s median 2026 growth estimate came in at 2.3%. What gives?
The FOMC’s median estimate for the year-end 2026 unemployment rate is 4.4%,vs 4.5% now. Where does the extra 0.5 ppt GDP growth come from if unemployment doesn’t drop substantially? Note that Powell, presumably speaking for the FOMC as a whole, said that BLS has probably been overestimating job growth by 60,000 per month since April, with the jobless rate not rising much only because of immigration policy. How is that consistent with accelerating growth?
This is not a case of a few partisan hacks skewing the central estimate; the lowest 2026 GDP growth estimate among policy makers this week was 2.0%, vs a median estimate of 1.8% in September.
Much of the forecasting world thinks the FOMC is optimistic. Morgan Stanley puts U.S. growth at 1.8% next year. The OECD says 1.7%. Vanguard, 1.9%. S&P Global says 2.0%. These views are missing from the FOMC’s range of estimates.
Even over the longer term, the low end of the FOMC estimate range is 1.7%, with 2.5% the top. I suppose this could reflect the CBO’s estimate of potential growth, which is higher over the next few years than at any time since 2005:
https://fred.stlouisfed.org/graph/?g=1OKRV
However, U.S. output is already running above potential, so above-trend growth in potential is needed just to catch up:
https://fred.stlouisfed.org/graph/?g=1OKSJ
There are a few forecasters who agree with the FOMC; RBC and Mastercard agree on 2.2%. BofA 2.4%. However, they mostly look for a sizable decline in the jobless rate, unlike the FOMC.
I don’t see what changed to convince policy makers that above-trend growth is likely next year, when output is above potential and the economy is sputtering into the end of the year.
Just as background, prime age labor participation is right at the top of its historic range, so it’s unlikely that some labor market miracle will boost our growth potential:
https://fred.stlouisfed.org/graph/?g=1OKSn
Nice analysis
These are all estimates, just keep in mind that all models are wrong, but some are useful.
Real GDP is just Nominal GDP with inflation removed. If they’re under-stating inflation, then Real GDP will skew higher.
In the same way, that under-potential and over-potential graph is just a reflection of growth vs inflation. If there is growth but no inflation they think “well then growth must be under-potential since the economy isn’t driving inflation” and vice-versa.
I believe we’re reaching the limits of monetary policy, asking it to fix all economic problems since elected officials don’t want to change their fiscal, tax, or regulatory policy to address the concerns of the day.
M.Nemonic: There’s no “potential GDP” graphed. The point of the graph is to show deceleration in consumption+fixed investment.
Two stories I find fascinating right now:
1- GDP is decoupled from employment.
2- Small business (<50 employees) employment loss is canceling out medium and large business employment growth.
It's a K-shaped economy for small businesses.