Numerous commentators have noted anomalies in the latest CPI release. Smith/Bloomberg quotes
“Lost in Translation,” according to TD Securities. “Delayed and Patchy,” per William Blair, and a “Swiss Cheese CPI report” from EY-Parthenon.
In contrast, the downside surprise was hailed by credulous NEC Director Kevin Hassett as “astonishingly good”.
Here are some visualizations to illustrate the anomalies in the report.
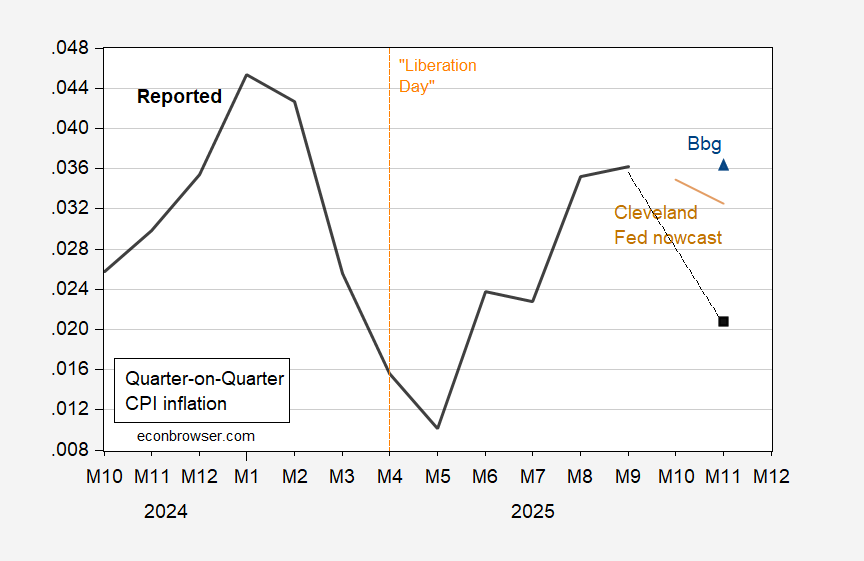
Figure 1: Quarter on quarter CPI inflation annualized (bold black), Bloomberg consensus (blue triangle), Cleveland Fed nowcast (tan). Source: BLS, Bloomberg, Cleveland Fed, and author’s calculations.
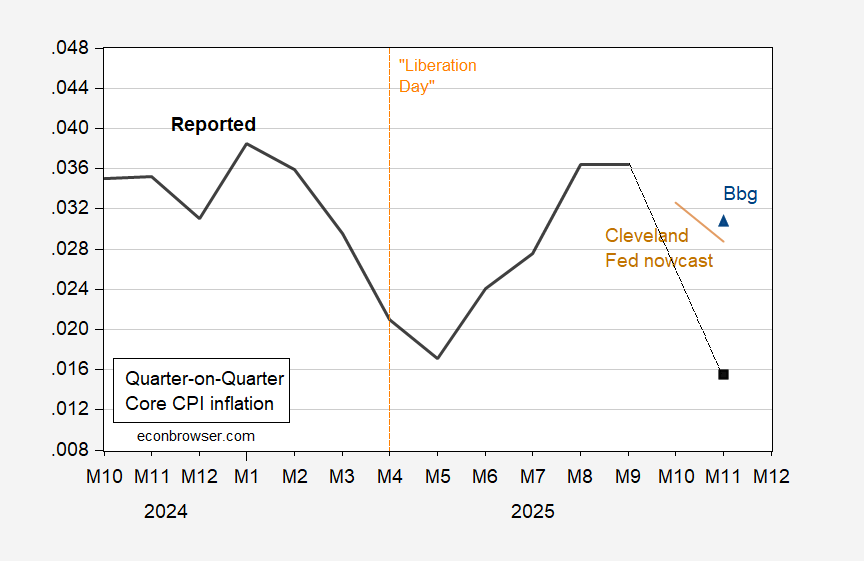
Figure 2: Quarter on quarter Core CPI inflation annualized (bold black), Bloomberg consensus (blue triangle), Cleveland Fed nowcast (tan). Source: BLS, Bloomberg, Cleveland Fed, and author’s calculations.
How unexpected are these realizations? Consider core CPI? I estimate a ARIMA(1,1,0) of (log) core CPI over the 2022-2025 period. In Figure 3, I plot the dynamic forecast along with ± 2 standard error.
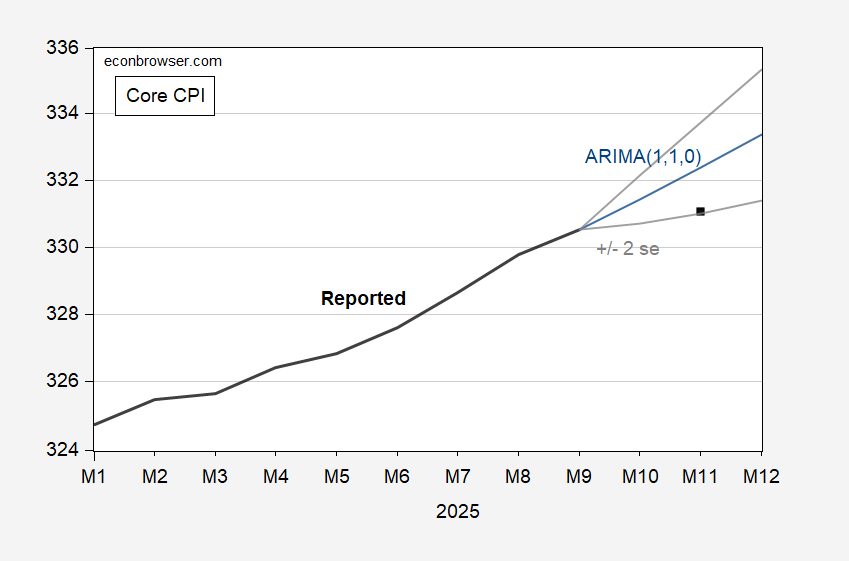
Figure 3: Core CPI (bold black), ARIMA(1,1,0) (blue), ± 2 standard error prediction interval (gray), 1982-84=100, all s.a. Source: BLS and author’s calculations.
The November realization is just at the outside 95% band. In that sense, the core CPI number is quite “astonishing”.
The treatment of shelter costs has been identified as a key issue. Essentially, no rent and OER inflation was assumed for October, dragging down the CPI level in November. In Figure 4, q/q CPI and CPI ex-shelter inflation is compared.
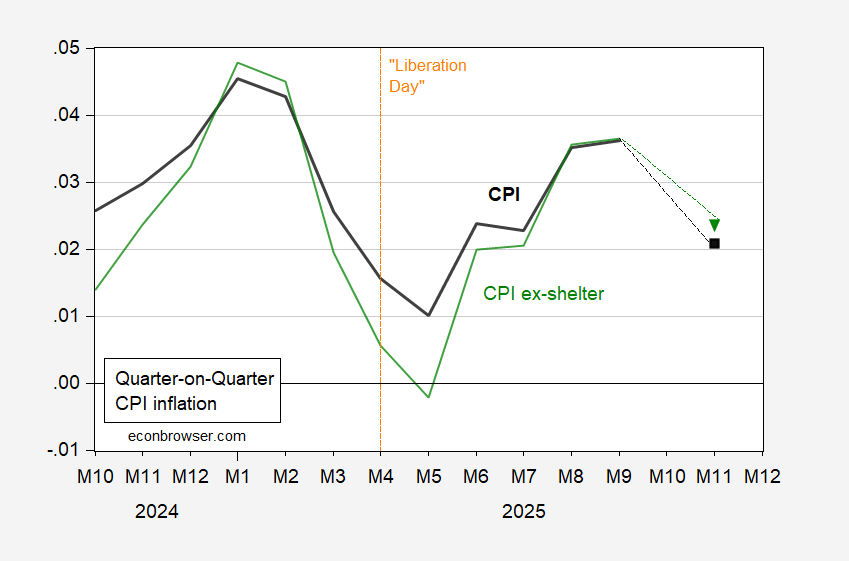
Figure 4: Quarter on quarter CPI inflation annualized (bold black), CPI ex-shelter inflation (green). Source: BLS and author’s calculations.
Other issues include the truncated sampling period for November — i.e., the latter half of the month, when holiday sale prices would be pervasive, thereby biasing surveyed prices downward.
In other words, it makes sense to be wary of the November numbers.
What’s the interpretation of a quarter-on-quarter annualized CPI growth number? My guesses are that it is annualized versions of either:
(1)Trailing three month average CPI vs previous month’s trailing three month average (T3M Nov’25 vs T3M Oct’25)
or
(2) Trailing three-month average of month-over-month CPI growth
or
(3) Trailing three-month average CPI vs three month lagged trailing three-month average CPI (T3M Nov’25 vs T3M Aug’25)
It wasn’t obvious to me at first, but typing this out I would guess you are using (3) as that allows you to use just Sep’25 and Nov’25 for the most recent reading and both (1) and (2) rely on an October value. Am I understanding this correctly?
JV: 3 month change, annualized. ((CPI/CPI[-3])^4-1)*100 on monthly data. Sorry for ambiguity.
Got it. Thanks for clarifying!
Apparently the Census Bureau assumed shelter CPI was unchanged for the missing month of October, and then calculated the September through November change and reported it.
While it is clear that the 0.15% increase in shelter was an outlier, the lowest such monthly change since 2020 – and before that there were only 4 months of similar small increases in the 7 years preceding the pandemic – there is some reason to believe that there may indeed have been a downdraft during the government shutdown, which may have done more damage to the economy than understood during its duration.
While OER lag house price changes by 12-18 months, the fact is whether measured by Case-Shiller, the FHFA, new home median prices, or existing home median prices, there has been a distinct sharp deceleration in the past year. For example, the latest Case Shiller and FHFA reports indicated YoY gains of only 1.3% and 1.7% respectively. House price gains have only been this weak in the past 35 years in the vicinity of the two consumer recessions, and briefly during 2023. In one such period, the early 1990s, CPI shelter came in between 3.0%-3.5%, generally in line with the report yesterday.
Further, there are several other measures of rent to compare. Median asking rent for Q3 was reported in the past week, only up 0.7% YoY. In fact, beginning in Q4 of last year, median asking rent has been up less than 1% each quarter – and even declined slightly YoY in Q1 of this year.
Perhaps even more importantly, the most recent experimental New and All Tenant Rent Indexes for Q2 that were reported by the BLS in July showed new rents falling off a cliff, with a YoY likely range of between -1.5% and -17.1%, with a median of -9.3%, while the range for *all* rents was between 2.4% and 3.2%, with a median of 2.8% YoY. This index is designed to lead the CPI for shelter by one or two quarters, if I recall correctly. Again, this is right in line with yesterday’s report.
So, yes, I continue to take yesterday’s CPI report with about a bucket of salt, but the cratering of shelter inflation may in fact be signal, amplified by the effects of the government shutdown*, and not just noise.
(*although I havent’ gone back to double-check, I seem to recall there was research around one or more the GOP led shutdowns during the Obama Administration indicating that they caused real economic damage that took months to recover from).