Total seasonally adjusted trade deficit averaged $75.1 mn, vs. 2024 $75.3 mn. The real goods trade deficit averaged $99.8 mn Ch.2017$ vs. 94.4 mn Ch.2017$. In other words, the real goods trade deficit increased (the same is true of the real goods ex-petroleum trade deficit).
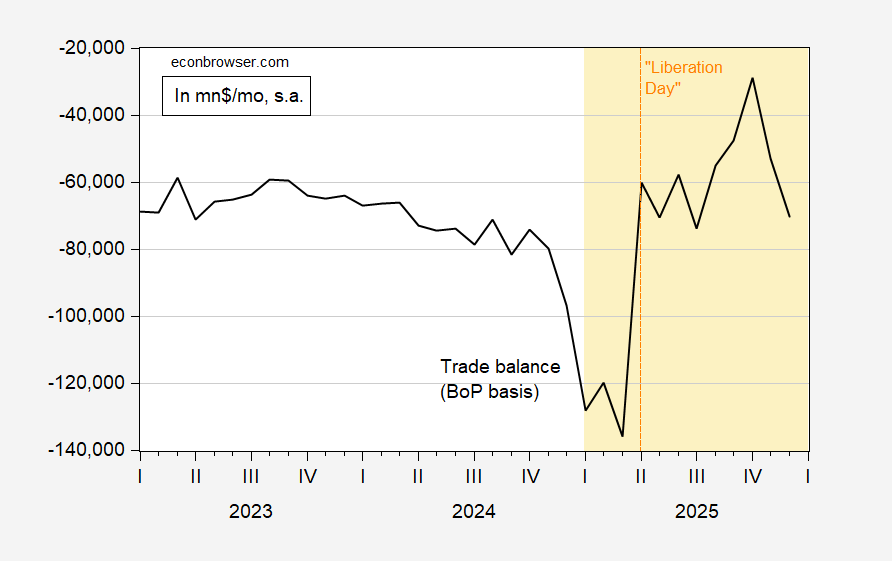
Figure 1: Trade balance, BoP basis, mn$ (black). Source: BEA.
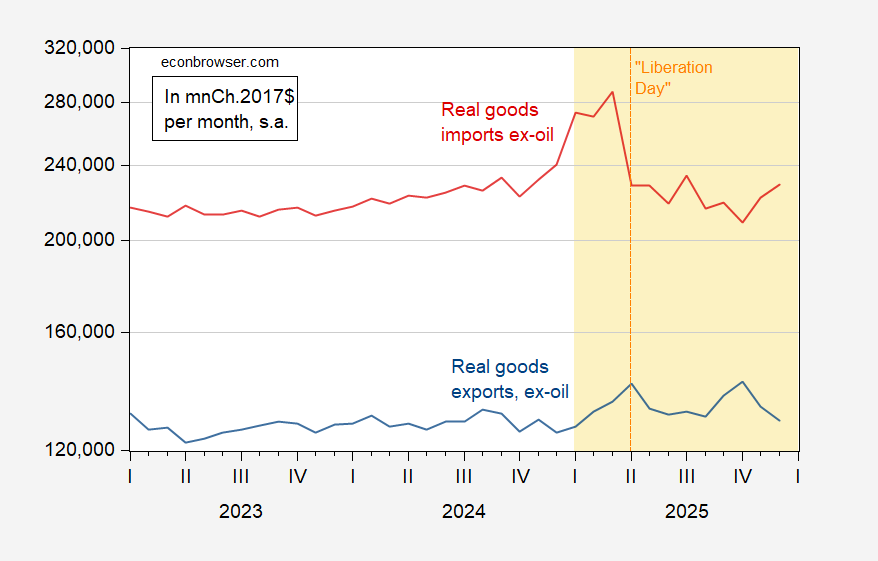
Figure 2: Real goods exports, ex-petroleum per month (blue), real goods imports, ex-petroleum per month (red), both in mnCh.2017$, s.a. Source: BEA.
If you thought macroeconomic aggregates (private saving vs. private investment, government budget balance, net income flows) determined primarily the trade balance, this outcome would not be very surprising.
Update:
Paweł Skrzypczyński has calculated the goods trade balance adjusting for gold exports and imports, using various assumptions. I plot the reported good trade balance on a BoP basis, and three measures he has calculated.
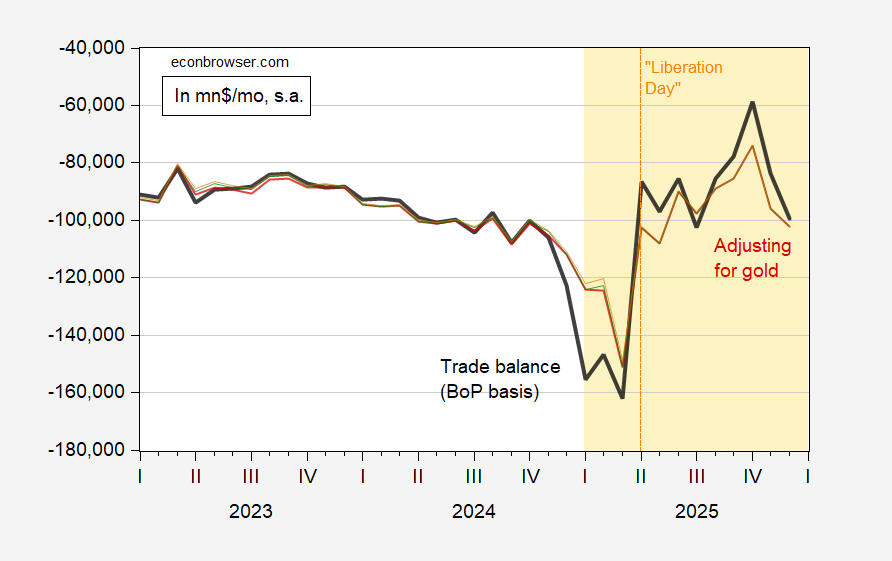
Figure 3: Goods trade balance, BoP basis, (bold black), adjusting for gold various methods (red, green, tan), all in mn$. Source: BEA via FRED, Paweł Skrzypczyński.
Using either the reported goods trade balance, or the gold adjusted goods trade balance, the deficit has increased going from 2024 to 2025: 2.1% using reported, 2.3% using adjusted.
More reporting on Russia’s attempt to bribe its say out of sanctions and into more Ukrainian territory:
https://www.economist.com/finance-and-economics/2026/02/17/how-big-is-the-prize-of-reopening-russia
Of course a massive bribe is being offered – the felon-in-chief demands bribes for just about everything. Russia has simply beaten him to the punch, offering a colossal bribe before the felon demanded it.
Ukraine would have to surrender territory. Once surrendered, Russia will continue to pressure Ukraine and build up capacity to take territory elsewhere. And the kicker is, any bribe not paid before Ukraine surrenders territory needn’t ever be paid.
Reinforces what I have said earlier: It appears the capital account is driving the current account, not vice versa.
That’s the story of printing the global trade currency.
A federal judge has just ruled that ICE detainees cannot be held without bond hearings:
https://thehill.com/regulation/court-battles/5745227-migrants-entitled-bond-hearings/
That creates a bottleneck, and that bottleneck raises two questions:
– Do we need all those ICE agents? If they grab people off the streets, but can’t hold them, what’s the point?
– Do we need all those new cages for holding ICE detainees if the cages can’t be filled?
Bond hearings require more judges and staff, which cannot be generated quickly. Any screening process, unless it is a complete fiction, will screen some ICE detainees out, so fewer cages, even if we manage to hire more judges and staff.
The felon-in-chief’s immigration policy is another instance of wishful policy-making, like his trade and defense and foreign policies. Real policy-making involves thought, preparation, oversight and expense. Bakshish isn’t an adequate basis for policy.