Most indicators suggest growth in output, spending aggregates (while employment is trending sideways). Housing is suggested as a leading indicator by Leamer (2007, 2015), but less a leading indicator recently (Green, 2022). Here’s a picture of residential fixed investment, which on average leads economic activity by approximately 7 quarters:
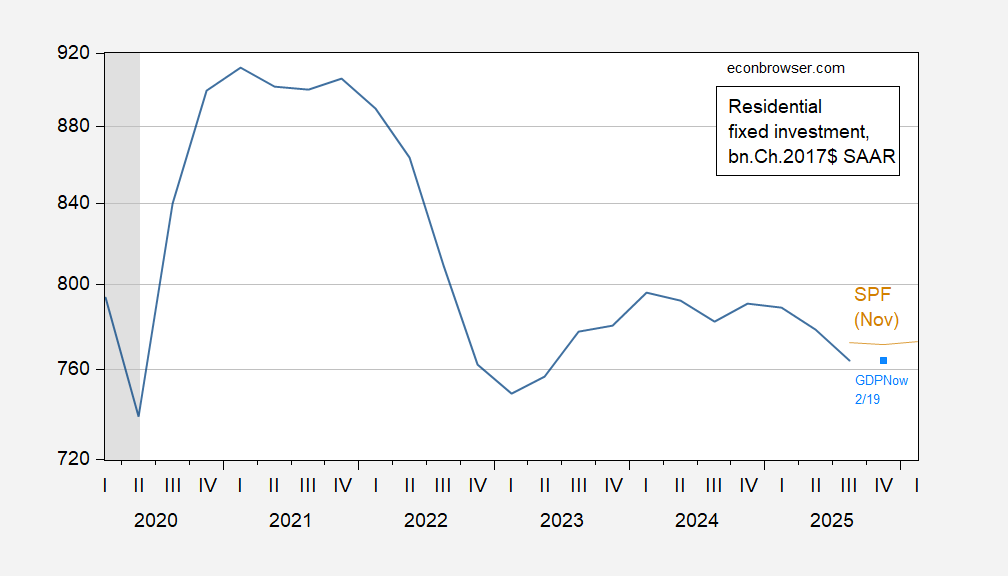
Figure 1: Nonresidential fixed investment (blue), Survey of Professional Forecasters November forecast (brown), GDPNow 2/19 nowcast (sky blue square), all in bn.Ch.2017$, SAAR. NBER defined peak to trough recession dates shaded gray. Source: BEA, Philadelphia Fed, Atlanta Fed, and NBER.
GDPNow has residential investment as flat in Q4, and below the November SPF trajectory.
On the other hand, some people claim “AI is the new housing” (here). I will note that over the 1986-2025 period (omitting the pandemic period, 2020-2022), residential investment appears to Granger cause GDP, while the reverse does not appear to be the case (at 5% msl).
A couple of developments that would seem to be working in opposite directions.
1) Mortgage rates drop to lowest level in nearly 4 years
https://finance.yahoo.com/personal-finance/mortgages/article/mortgage-rates-drop-to-lowest-level-in-nearly-4-years-110045487.html
2) Fed officials signal shocking twist on interest-rate cuts
https://finance.yahoo.com/news/fed-officials-signal-shocking-twist-181700773.html?fr=sycsrp_catchall
So, as soon as things look a little brighter on the mortgage rates side, the New York Fed is thinking that with inflation roaring at 2.4% (versus the 0.91% under Biden… or was that 9.1%, i get so confused) that maybe interest rates should be jacked up again…. which while different rates and sources are related.
“Mortgage rates do not directly follow the federal funds rate, as they are more closely tied to long-term interest rates, particularly the yield on the 10-year Treasury note. However, changes in the federal funds rate can influence mortgage rates indirectly, as both tend to move in the same general direction over time.”
— fanniemae.com
There is nothing “shocking” about the discussion of passibly raising rates. Whenever policy is near neutral, there is a reasonable chance the next move will be to higher rates. Anyone who doesn’t understand that has no business talking about monetary policy – that means you, Brucey.
If I recall correctly, Leamer’s preferred metric was private residential fixed investment as a share of GDP. Without loading up a bunch of graphs, the typical housing progression is that after mortgage rates increase, housing permits decline, then starts, and then housing units under construction. All of these decline, followed finally by residential construction employment, and then finally new housing for sale (as builders throw in the towel).
As per the above, I’ll spare all the other graphs, but usually in the past, the conduit through housing units under construction took less than a year. But in the post-pandemic era, it took much longer. Here’s the historical look for the past 50+ years including the present:
https://fred.stlouisfed.org/graph/fredgraph.png?g=1Sbsc&height=490
It is only in the past 12 months that units under construction have declined to the point where it could be considered recessionary. (I suspect this has to do with much longer times to go from starts to completion; per unit of construction, there were far fewer employees involved this time). And it only in the past few months that new housing inventory for sale has turned down. And residential construction employment is only down a few percent.
So why no recession? And this is where AI comes into play. The big gains in industrial production in 2025 came from electric utility production. And *non*-residential construction employment has continued to Boom, likely driving the stock market Boom and the “wealth effect” spending by the top echelons:
https://fred.stlouisfed.org/graph/fredgraph.png?g=1SbxO&height=490
Leamer may yet be proven right (*if* AI data center building is a bubble that pops), although by no means close to the 7 Quarters average lag time that he indicated was the case in the past.
Even absent a bubble in the conventional sense, if AI data center build-out follows a typical sigmoid curve, there will be a sharp slowdown at some point.