NBER BCDC indicators and alternatives:
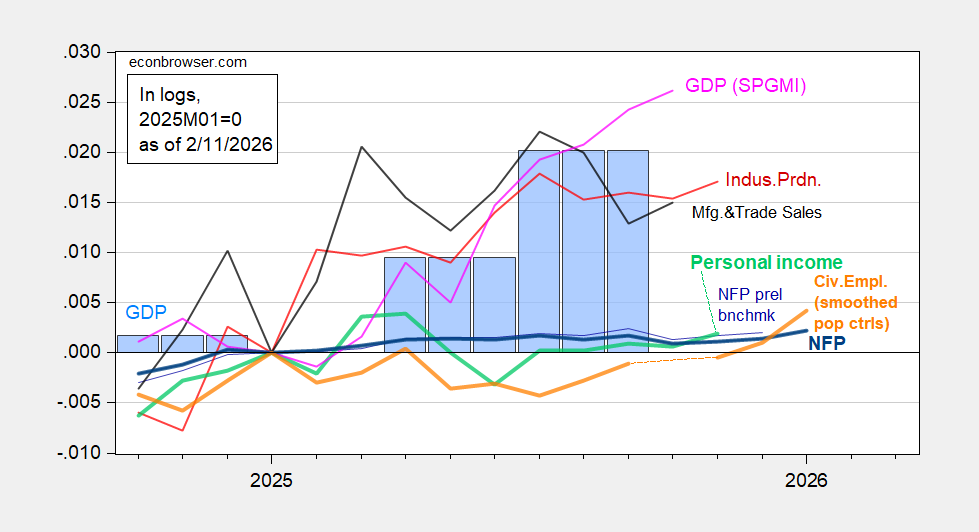
Figure 1: Implied NFP preliminary benchmark revision (thin blue), post-benchmark NFP (bold blue), civilian employment with smoothed population controls (bold orange), industrial production (red), personal income excluding current transfers in Ch.2017$ (bold light green), manufacturing and trade sales in Ch.2017$ (black), and monthly GDP in Ch.2017$ (pink),GDP (blue bars), all log normalized to 2025M01=0. Source: BLS via FRED, BLS, Federal Reserve, BEA 2025Q3 revised release,S&P Global Market Insights (nee Macroeconomic Advisers, IHS Markit) (1/2/2025 release), and author’s calculations.
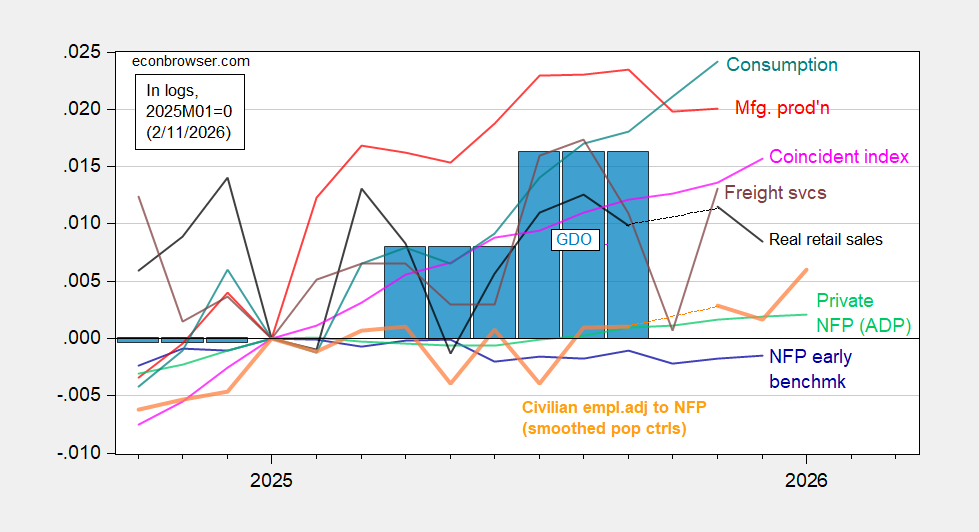
Figure 2: Implied Nonfarm Payroll early benchmark (NFP) (blue), civilian employment adjusted to NFP concept smoothed population controls (bold orange), manufacturing production (red), ADP private nonfarm payroll employment (green), real retail sales, CPI deflated (black), freight services indexes (brown), and coincident index in Ch.2017$ (pink), GDO (blue bars), all log normalized to 2021M11=0. Source: BLS, ADP,via FRED, Philadelphia Fed [1], Philadelphia Fed [2], Bureau of Transportation Statistics, Federal Reserve via FRED, BEA 2025Q3 revised release, and author’s calculations.
The revised data is consistent with something I wrote a few weeks ago; namely, that the government shutdown may well have caused a “mini-recession.”
Also, a few notes on the monthly data and revisions:
1. The revised manufacturing employment series show a more pronounced decline through December, with a small rebound in January.
2. Similarly, there was a deeper decline in construction employment, but a sharp rebound in nonresidential construction employment since October. Maybe AI data center building? ICE concentration camp building?
3. December and January are the most difficult months for the BLS to get the seasonal adjustments correct. The last big positive surprise was December 2024 followed by a decline in January 2025. I suspect the last two months have been something of a mirror image.
4. The decline in the unemployment rate is no surprise; it was pretty clearly telegraphed by very low initial and continuing jobless claims since November.
In a high-debt, no immigration, aging economy, Trump and the GOP are steering the U.S. into a long term fiscal trap. New CBO projection lifts deficits by $1.4 trillion over 10 years, largely from: 2017 tax cuts extended + new breaks, Immigration enforcement costs, Interest expense compounding. Interest expense alone rises from: $1T in 2026 → $2.1T in 2036. CBO assumes: 10-year yields ~4.4% and there will be continued global demand for Treasuries (both dubious IMO). We will all be saddled with a huge debt burden, widening inequality, and slow growth for years to come. https://www.bloomberg.com/news/articles/2026-02-11/cbo-boosts-us-deficit-call-by-1-4-trillion-on-trump-policies
Good catch.