Industrial and manufacturing production rise, surprising on the upside:
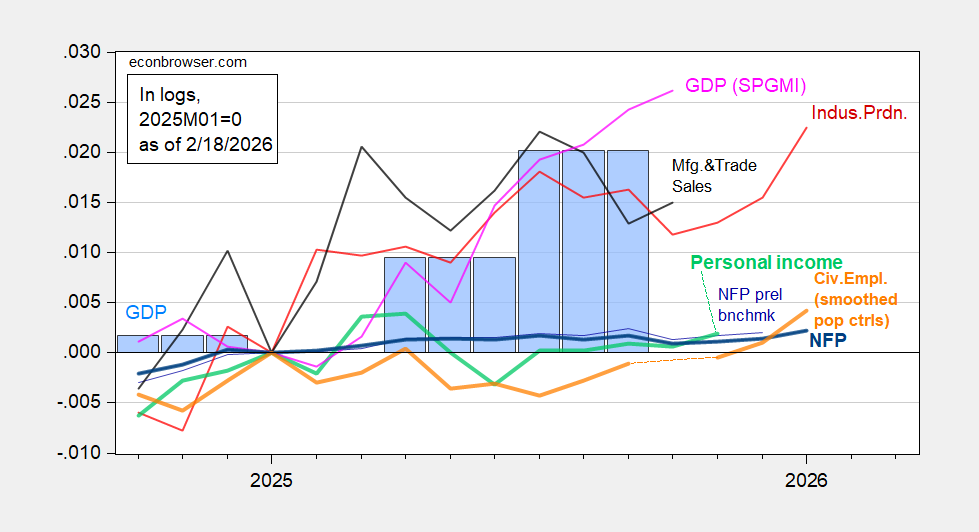
Figure 1: Implied NFP preliminary benchmark revision (thin blue), post-benchmark NFP (bold blue), civilian employment with smoothed population controls (bold orange), industrial production (red), personal income excluding current transfers in Ch.2017$ (bold light green), manufacturing and trade sales in Ch.2017$ (black), and monthly GDP in Ch.2017$ (pink),GDP (blue bars), all log normalized to 2025M01=0. Source: BLS via FRED, BLS, Federal Reserve, BEA 2025Q3 revised release,S&P Global Market Insights (nee Macroeconomic Advisers, IHS Markit) (1/22/2026 release), and author’s calculations.
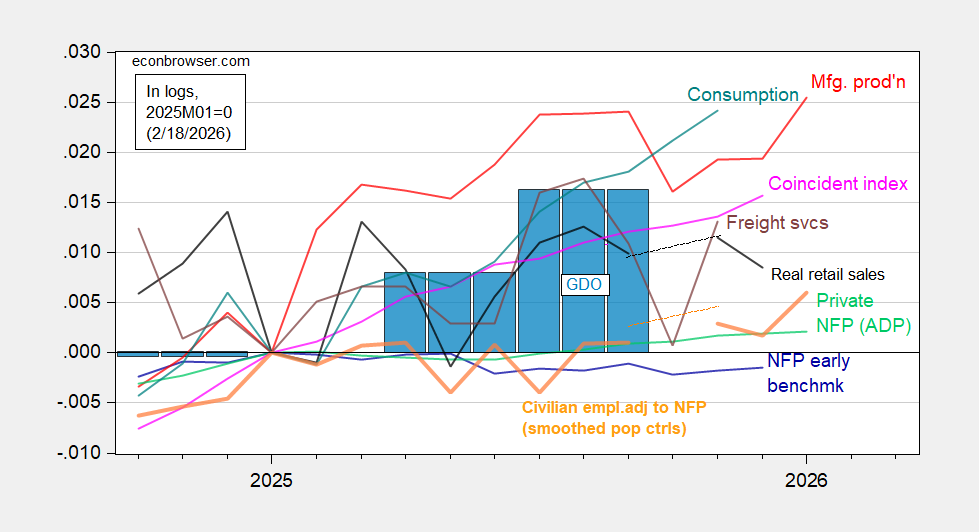
Figure 2: Implied Nonfarm Payroll early benchmark (NFP) (blue), civilian employment adjusted to NFP concept smoothed population controls (bold orange), manufacturing production (red), ADP private nonfarm payroll employment (green), real retail sales, CPI deflated (black), freight services indexes (brown), and coincident index in Ch.2017$ (pink), GDO (blue bars), all log normalized to 2021M11=0. Source: BLS, ADP,via FRED, Philadelphia Fed [1], Philadelphia Fed [2], Bureau of Transportation Statistics, Federal Reserve via FRED, BEA 2025Q3 revised release, and author’s calculations.
Note that the cumulative change in GDO is below that of GDP. Nonetheless, all output measures (recalling industrial output, manufacturing output are gross measures) have grown much more than any given employment series.
Retail sales tomorrow; GDP on Friday.
Speaking of industrial output and employment, there is a good bit of talk about how AI is going to boost productivity, and also a good bit of talk about how it hasn’t:
“…firms report little impact of AI over the last 3 years, with over 80% of firms reporting no impact on either employment or productivity.”
https://www.nber.org/papers/w34836
The massive rise in domestic microchip production capacity coming on line as the result of the CHIPS Act will involve hardly any additional employment – these factories are highly automated. As a result, measured productivity at these plants will be extremely high. We should be careful not to attribute this coming gain in productivity to AI.
Off topic – the military-tracking part of the internet is abuzz with the continued pileup of weaponry and – particularly now – support for weaponry in the Middle East. Here’s a sample:
https://www.twz.com/news-features/final-pieces-moving-into-place-for-potential-attack-on-iran
Brent is up 4% today, to the highest price since last July.
Distracting us from the Epstein files is hard work, with a cast of thousands.
The White House has just released a “study” by the Council of Economic Advisers accusing the Consumer Financial Protection Bureau of raising the cost of credit:
https://www.whitehouse.gov/research/2026/02/estimating-the-cost-of-the-consumer-financial-protection-bureau-to-consumers/
From the Summary:
“The Council of Economic Advisers (CEA) estimates that since 2011, the CFPB has cost consumers between $237-$369 billion, including fiscal costs, increased borrowing expenses, and reduced originations.”
Just a few observations. First, the foundation offered for the assertion that the CFPB has caused an increase in the cost of credit is a paper cited as “Mulligan 2024”. The CEA does not otherwise identify the paper, nor is there a list of references. I assume the “Mulligan” in question is Casey Mulligan. If so, perhaps it’s worth noting that Casey Mulligan served as the head of the CEA during the felon-in-chief’s first administration and currently works for the felon’s Small Business Administration.
Second, the “study” claims hundreds of billions in costs, but doesn’t show its work. We are required to trust the felon-in-chief’s CEA. Here’s an instance of why we shouldn’t:
“In addition to the 400 final rules and formal advisory opinions, CFPB has avoided transparency.”
Four hundred? Nope. Not close. I get 153, but count ’em for yourself:
https://www.consumerfinance.gov/rules-policy/final-rules/?title=&categories=final-rule&from_date=&to_date=
https://www.consumerfinance.gov/compliance/advisory-opinion-program/
Third, the study claims costs, but makes no effort to tally up benefits. We can’t know whether the CFPB is doing good work without weighing costs against benefits. Allow me to demonstrate:
– Food costs money, so food is bad.
– Housing costs money, so housing is bad.
– Music requires time and attention which could be spent on something else, so music is bad.
– Sex makes me sweaty and requires time and attention, so like music, sex is bad.
See how not considering benefits might lead to dumb conclusions?
The CEA study is a smear job. Not that you needed me to tell you that – just take a look at the rhetorical style. The point is, the felon-in-chief is at it again, trying to end consumer protections to enrich his cronies. They, in turn, enrich him. If you doubt that, I have a bridge between Windor and Detroit I’d like to sell you.
industrial and manufacturing production revisions tell a different story than the headlines…the December change was revised from an increase of 0.4% to an increase of 0.2%, and the November change was revised from an increase of 0.4% to an increase of 0.1%…the industrial production index itself, set for average 2017 production to be equal to 100.0, rose to 102.3 in January from 101.6 in December, after the December index was revised from the 102.3 reported last month to 101.6, the November index was revised from 102.0 to 101.4, the October index was revised from 101.5 to 101.3, and the September index was revised from 101.8 to 101.7…that was as the December manufacturing index was revised from 97.4 to 96.9, the November manufacturing index was revised from from 97.2 to 96.9, the October manufacturing index was revised from 96.9 to 96.6, and the September manufacturing index was revised from from 97.5 to 97.4…at 97.5, the January manufacturing index is 2.5% below the 2017 average…
at the same time, the backlog of orders for durable goods tells a different story than the widely watched and reported on 1.4% decrease in new orders…unfilled orders for manufactured durable goods rose 0.9% in December, which left the unfilled order book for durable goods 10.3% above the level of last December, with unfilled orders for transportation equipment 16.0% above their year ago level, led by a 20.3% YoY increase in the backlog of orders for civilian aircraft…
anecdotes from this part of Ohio are that the orders keep flooding in, but no one is pulling the trigger on increasing production…
I believe the FAA has told Boeing to limit output due to quality control problems.