And headline CPI was below. Here’re price levels for several CPI components:
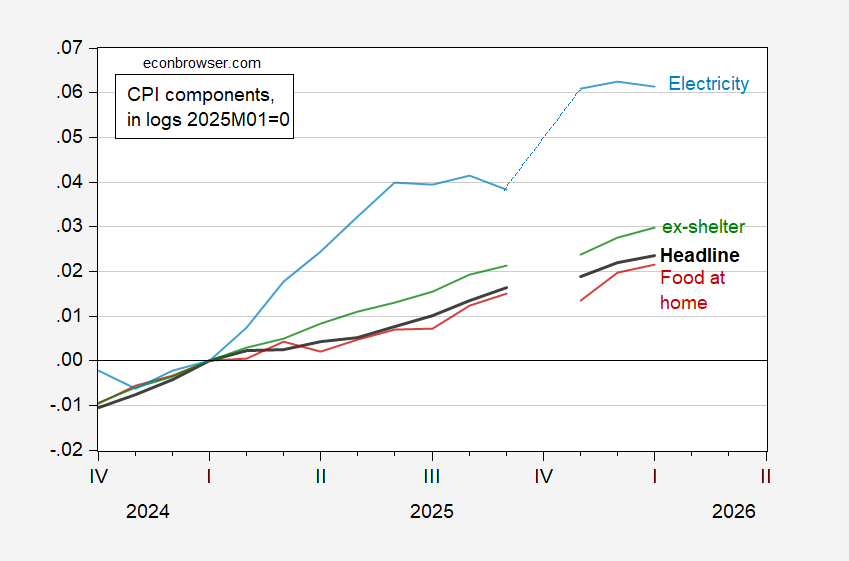
Figure 1: CPI (bold black), CPI food at home (red), CPI ex-shelter (green), CPI electricity (light blue), all s.a., in logs, 2025M01=0. Source: BLS, and author’s calculations.
Grocery prices keep on rising in January. Food price component and ERS forecasts:
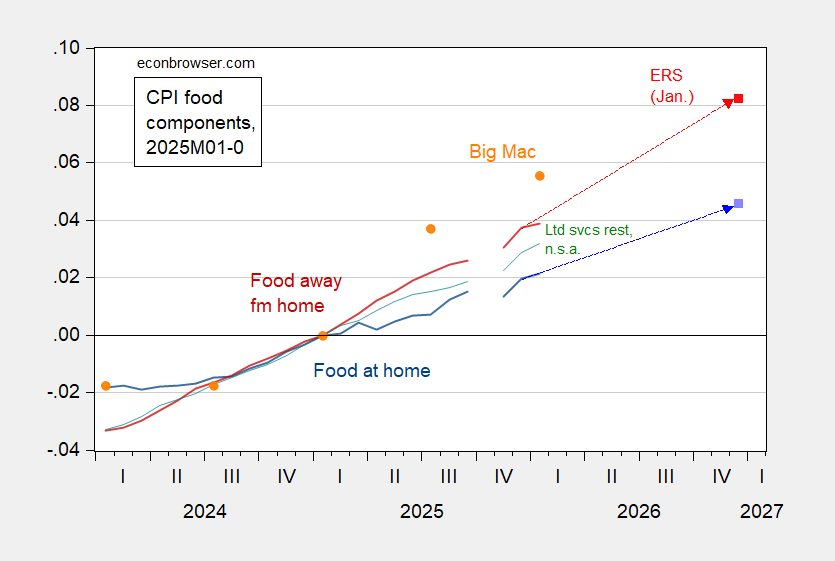
Figure 2: CPI – food at home (blue), ERS January forecast (light blue square), CPI – food away from home (dark red), ERS January forecast (red square), CPI – food away from home, limited services restaurants, n.s.a. (green), Big Mac price, n.s.a. (orange circle), all in logs 2025M01=0. Source: BLS via FRED, BLS, ERS, Economist, and author’s calculations.
Reported CPI food indices seem a little strange around October. The price index for food away from home has diverged from grocery prices; ERS forecasts December 2026 year-on-year inflation at 4.6%, up from 4.1% in 2025.
As a check on magnitudes, I plot Big Mac prices (in US$), sourced from the Economist. In January, they were up 5.5% relative to January 2025.
Core CPU up 0.3% in January, which annualizes to 3.6%. In March, April and May of last year, core CPI had slowed to 0.2% or less, but has since accelerated as tariffs have taken effect and continue to be passed through:
https://fred.stlouisfed.org/graph/?g=1RLQN
With passthrough still underway, we can expect core inflation to remain elevated for some months.
Brucey may, of course, instruct an AI bot to contradict the data, as is his new habit. Apparently, he thinks getting a bot to say what he wants it to say makes his abuse of data more credible.