From Townhall today:
As of today, y/y CPI inflation is 0.93%!
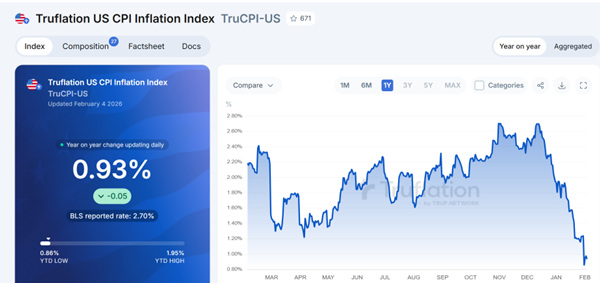
Source: Truflation, accessed 2/4/2026 3pm CT.
For comparison, a month ago, the inflation rate was 1.95% y/y; hence we achieved a percentage point disinflation in a month! Two months ago, the Truflation rate was 2.48%, so that inflation has come down around a percentage point and a half over that time period.
EJ Antoni (also Chief Economist of Heritage) explains the numerical difference between Truflation inflation and CPI measured inflation thusly:
…CPI assigns housing about one-third of its weight, whereas Truflation is closer to one in four.
That makes everything else weigh more in Truflation. So if gasoline or eggs are coming down, as they are now, it’s a bigger deflation in Truflation.
But the kicker here is it’s actually housing that’s coming down now, along with rents. Even the slight easing of interest rates since over the last several months has brought more supply to the market, pushing down prices…
OK, we have encountered Dr. Antoni’s “magic asterisk” housing deflators elsewhere (in that case, he argued GDP had been in decline from 2022 to 2024). But, let’s compare BLS CPI-headline, CPI-ex shelter, and Truflation y/y measures.
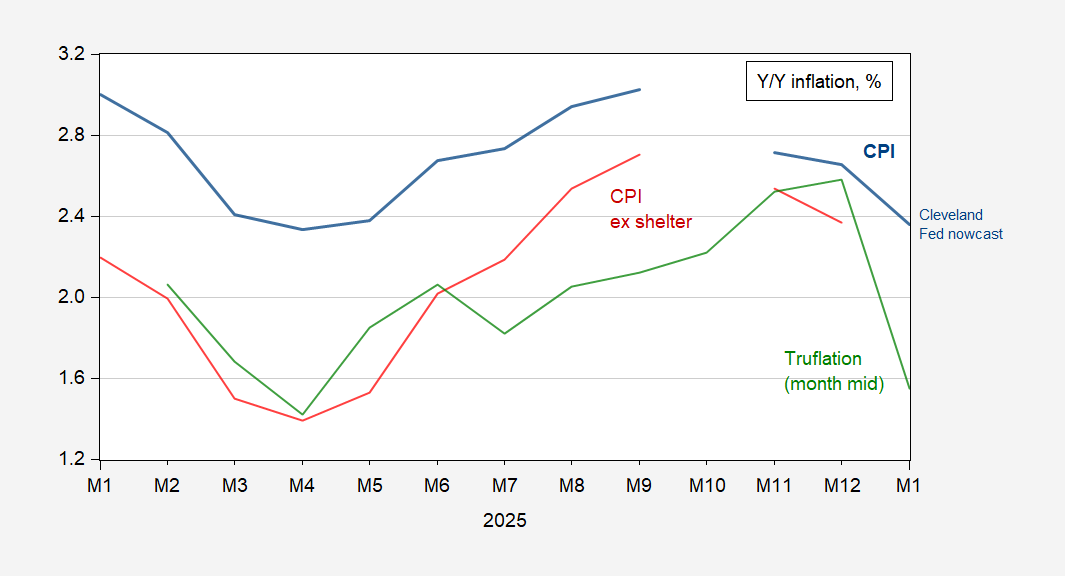
Figure 1: Year-on-Year headline CPI inflation (bold blue), CPI ex-shelter (red), Truflation inflation (green). Truflation measures are at mid-month. CPI-headline January 2026 observation is Cleveland Fed nowcast of 2/4/2026. Source: BLS, Truflation, Cleveland Fed, and author’s calculations.
We can see how much the treatment of housing costs affects the CPI, in part, by including the CPI-ex shelter index. I’m willing to believe that Truflation might provide additional insights, but I’m dubious about overall dropping as rapidly as Truflation indicates in January. If indeed they are dropping as fast as Truflation suggests, I say “think imminent recession”.
I’m all for the use of big data, but I like the documentation to be complete (e.g., Cavallo et al., vs. the two-pager Truflation provides*) I wouldn’t give too much credence to an inflation measure that exhibits such wide swings day-to-day as Truflation. But that’s just me.
* Why does the table in the documentation refer to ONS? Seems a little sloppy to me.
wow, Trump has performed an economic miracle as the recession whisperer is NEVER wrong
The manufacturing boom President Trump promised would usher in a golden age for America is going in reverse. After some recovery from the pandemic under Biden who invested in renewable energy jobs, fewer Americans work in manufacturing than any point since the pandemic ended. Manufacturers shed workers in each of the eight months after Trump unveiled “Liberation Day” tariffs. https://www.wsj.com/economy/u-s-manufacturing-is-in-retreat-and-trumps-tariffs-arent-helping-d2af4316
See also The Populist Right Will Fail to Help Workers or Outflank the Left https://newsletter.mikekonczal.com/p/the-populist-right-will-fail-to-help
what makes you think there is any logic to this number? it is a black box whose output function is aligned with whatever will make trump happy. if you are looking for a real mathematical model to verify this output, you will be looking for a long, long time.
these folks see a grift. if trump were to demand that official business (say cost of living increases, etc) should be aligned with a private market number, then the folks at truflation could score big money in selling the government their number. trump would be happy to buy the number from a firm that acquiesces to his wants. this is simply part of the transaction.
Truflation started publishing in December 2021. Here is a link to its method:
https://truflation.com/blog/everything-you-need-to-know-about-truflations-index-methodology
It is similar to the “Billion Prices Project” of a decade ago. Despite the unfortunate hiring of Antoni, I have no reason to think that it’s data is politically skewed.
I suspect the makeup of the inputs to the Truflation index are very different than the CPI. In fact they state outright that the weight shelter costs differently, and use a different method. I suspect the output is heavily skewed towards retail prices, as to which there has been some blowback from customers fed up with “shrinkflation” and similar post-pandemic trends.
In general I would take the upward or downward *trend* in the Truflation numbers as a decent proxy for the trend in CPI ex-shelter, but much more timely.
thanks for the link. in their description, it stated
“Category weightings are updated at the beginning of each year to reflect changes in consumer behavior.”
looks like they get a discreet change to their calculation at the beginning of each year. is the latest measurement the first one with those changes to the weightings?
“ is the latest measurement the first one with those changes to the weightings?”
Fair question. I don’t know.
A valid measure of core/trend inflation should be less not more volatile than headline CPI, no?
Is it just me, or does it seem like everything is going pear shaped? The whole economy is bumping its way down into recession. It’s a little like watching a branch slowly get eaten by a wood chipper. The small branches and leaves don’t get eaten until the main branch has been turned into chips.