Tyler Godspeed (former acting CEA Chair Trump 1.0; chief economist ExxonMobil) observes that shocks as determinants of recessions means they are essentially unpredictable.
If you look back over not just the past 80 years, but indeed over the last three and a half centuries, energy is one of those sectors that has generated, or has been subject to, a lot of shocks that then permeate the rest of the economy. It’s not hard to see why, because energy is an input into a lot of other sectors, and it is very difficult over a 12-month or even 24-month time horizon to find substitutes for fuels, for heating, for the materials that use petroleum products.
I don’t have at hand 350 years of energy prices, but here’s the one relevant for the US over the past century past.
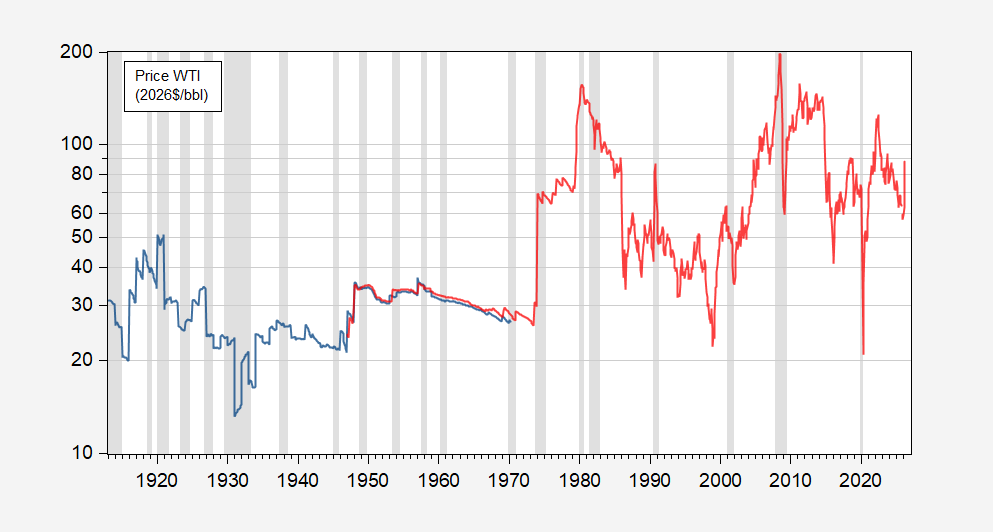
Figure 1: CPI-deflated price of oil (WTI), in 2026$/bbl, annual (blue), monthly (red), both on log scale. NBER defined recession dates shaded gray. Oil prices 1913-1970 annual. March oil price data is through 3/30; March CPI data is Cleveland Fed nowcast. Source: EIA, CPI via FRED, EIA, NBER, and author’s calculations.
As Godspeed correctly points out, the highest price (real as well as nominal) is recorded in 2008; However, there’s a question — as always — whether level of change is the relevant variable. This is particularly true if one is thinking of “shocks”. If one thinks of oil prices as partly endogenous in the smooth run-up in prices, then one would more likely want to focus on differences. Below in Figure 2 is the year-on-year log difference in real oil prices.
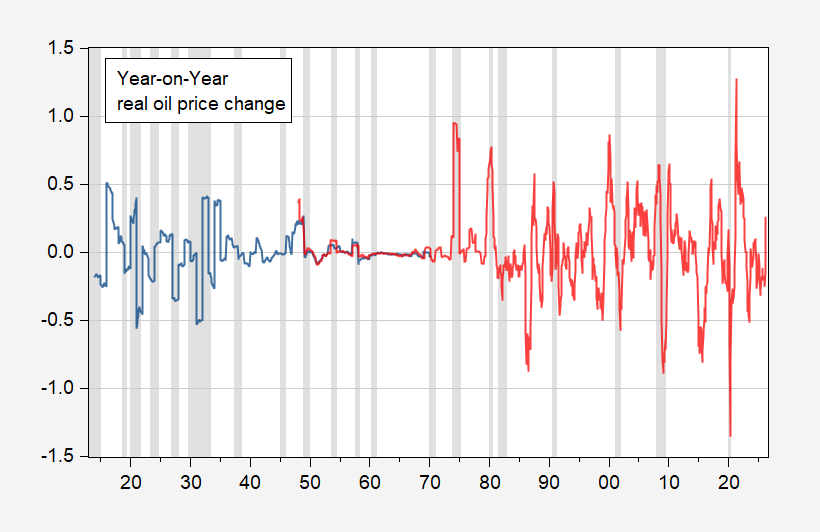
Figure 2: Year-on-Year growth rate of CPI-deflated price of oil (WTI), in 2026$/bbl, annual (blue), monthly (red), both on log scale. NBER defined recession dates shaded gray. Oil prices 1913-1970 annual. March oil price data is through 3/30; March CPI data is Cleveland Fed nowcast. Source: EIA, CPI via FRED, EIA, NBER, and author’s calculations.
In this context, the 2008 year-on-year change of 640% is larger than the 1979-80 increase which presaged the 1980 recession, but on a month-on-month basis does not come close to the 1973 or 1990 changes. And (thinking of Sims’s work, I’d be more inclined to use this object in a VAR), maybe the month-on-month or quarter-on-quarter changes would be more appropriate.
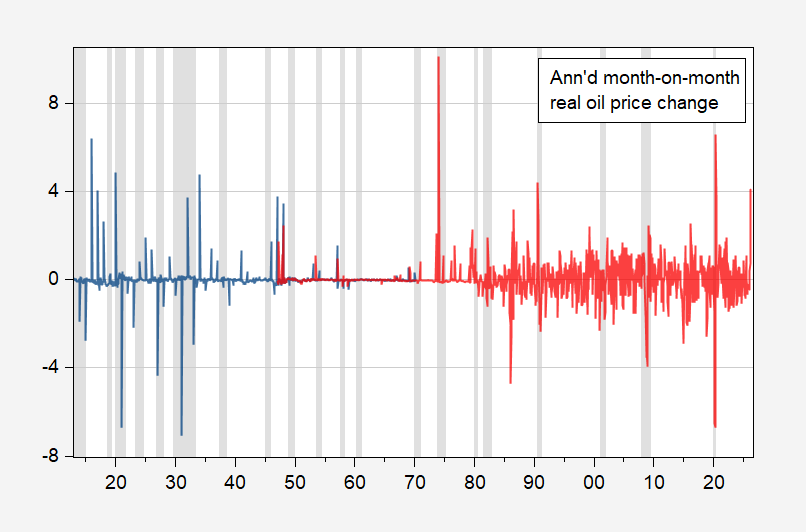
Figure 3: Annualized month-on-month growth rate of CPI-deflated price of oil (WTI), in 2026$/bbl, annual (blue), monthly (red), both on log scale. NBER defined recession dates shaded gray. Oil prices 1913-1970 annual. March oil price data is through 3/30; March CPI data is Cleveland Fed nowcast. Source: EIA, CPI via FRED, EIA, NBER, and author’s calculations.
If the month-on-month changes more closely resemble a shock, then we’re in for some “propagation” in the next months (the graph reads “400%” shock).
Economists tend to think in price-adjusted terms, and that’s what Godspeed does here. No harm done, since there is an obvious correlation between real oil price shocks and recessions.
I’m not sure a real-price presentation is necessary here, or even the best choice, because nominal prices are important here. Expenditure shifting, income effects, the cost of production and transportation of goods (and some services) are all straightforwardly influenced by the price of oil, so why adjust away a part of that price? Is there some obvious improvement to this analysis from using inflation-adjusted prices?
I understand that real values are often the better choice in analysis, but reflexively removing a component of prices when discussing prices seems unwise. Figure out whether adjust for inflation improves the analysis before adjusting for inflation.
I think when one calculates the “real” cost of an item that is already part of a price metric like the CPI, the best deflator is how long an average person has to work to pay for it. So the graph linked to below deflates oil prices by average hourly nonsupervisory earnings:
https://fred.stlouisfed.org/graph/fredgraph.png?g=1Ukn8&height=490
Since the WTI is finishing March at roughly $100/barrel, that is the current value. This makes the current oil shock approximately equal to 1974 and 1991, which were associated with recessions, but also 2011 and 2022, which weren’t. The period from 1980-85 and 2005-14 featured “real” wage adjusted oil prices higher than the present. Two very big recessions and in the latter case a lackluster expansion were correlated with that price level.
Seems likr the Iran war is spreading. Wars tend to do that.
Drones launched from Iraq hit Syria:
https://www.turkiyetoday.com/region/syria-says-large-scale-drone-attack-targets-army-bases-near-iraqi-border-3217145
This is almost certainly not Iraq attacking Syria. It is more likely that Iran’s allies inside Iraq are attacking Syria. There are unsourced claims floating around that Syria allowed Israel to transit through Syrian territory to attack Iranian allies in Lebanon. Israel has seized land in Syria which it is using to launch attacks into Lebanon, but this new claim is that Syria’s al Jolani approved wider Israeli use of Syrian territory.
Two weeks ago, Syria was resisting U.S. requests that Syria attack Hezbollah:
https://www.pakistantoday.com.pk/2026/03/18/us-encourages-syria-to-take-action-against-hezbollah-but-damascus-remains-hesitant-sources
So if al Jolani is actively helping Israel, it amounts to an escalation.
As the war goes on, it widens to include more the Middle East; y’all will have noticed thatthe Houthis have joined in just a bit. Some of the widening comes down to Sunni against Shi’ite. I don’t see how killing off a bunch of Hezbollah fighters solves the long-term Sunni/Shia conflict. In our Second Iraq War, every insurgent fighter we killed recruited more insurgent fighters. Seems like that might happen now in Iran, Iraq, Lebanon and Syria. An eye for an eye, until everyone is blind.
Segregation of the global oil market can bee seen in the divergence of benchmark oil prices during the Iran war. Historically, Brent and WTI prices are rarely more than $10 apart and usually less than $6. However, the spread has widened considerably during the war:
https://fred.stlouisfed.org/graph/?g=1UkqY
The spread has been as wide as $21.97. A week ago, it was $14.46 and today is down to $9.15, give or take. Eventually, arbitrage does its job. Apparently, that arbitrage is about to be not entirely the result of financial trading:
https://finance.yahoo.com/sectors/energy/articles/china-set-resume-us-energy-222348918.html
China is set to pick up 600,000 barrels of U.S. crude per day starting in April. Call U.S. daily output 13.7 million barrels per day (on the generous side) and 900k bbls amount to 6.6% of daily production. That’s enough to move prices, and China won’t be the only one.