Using NYMEX futures for May, June:
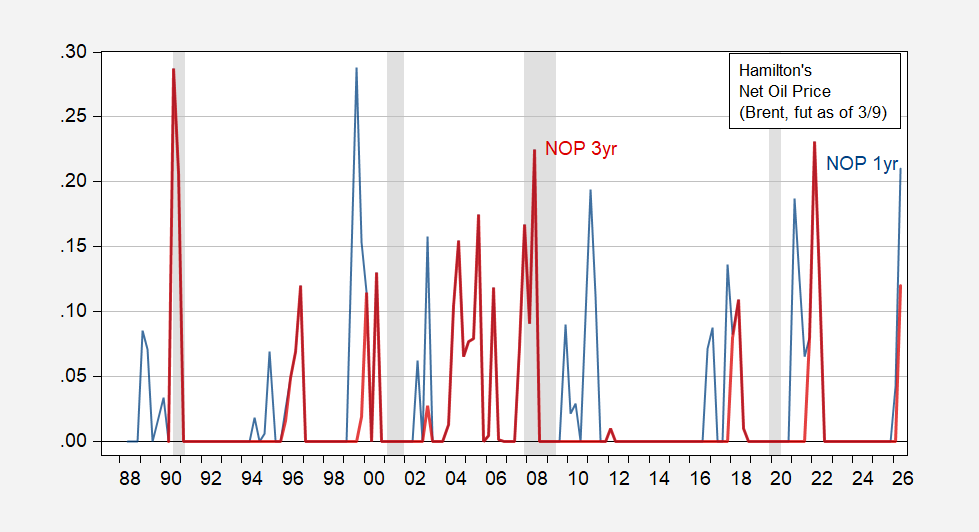
Figure 1: Net Oil Price (Brent), defined relative to previous year (blue), defined relative to previous 3 years (red). NBER defined peak-to-trough recession dates shaded gray. Source: EIA via FRED, NYMEX via barchart.com, NBER, and author’s calculations.
The one year measure is due to Hamilton (JPE, 1983) and the three year to Hamilton (J.Econometrics, 2003). Jim’s recent review of oil prices and macroeconomy in the New Palgrave of Economics here.
The NOP calculations go through Q2; I use futures as of today of about $94/bbl (Brent) for June, $100 before. NYMEX futures as of 2pm CT indicate about $77 by December settlement, so the market anticipates a resolution of some sort that opens up the Strait of Hormuz by then.
The association between recession and NOP is unclear, or not as clear as the pre-2010 period. As for inflation, the correlation between NOP and PCE deflator inflation is more obvious.
Off topic – water shortage in Corpus Christi:
https://www.texastribune.org/2026/03/08/texas-corpus-christi-water-crisis/
Seems like Tehran, Jo-burg and Capetown aren’t the only place where drought threatens to shut a city down.
I kinda think the “shut down Texas if you don’t do something” vibe is meant to solicit outside help, rather than reflect the most likely outcome. But what do I jnow?
With a population just over 300k, this is a small-scale example of the sort of things we need to learn how to deal with. Ya know, with good leadership and wise policy and stuff.
The solution is desalination plants and that creates a drastic increase in water prices. So the “crisis” is not one of “lack of water” but one of “lack of cheap water”.
Thd choice to pay up for desalination has, reportedly, been a stumbling block. If they can’t make the decision to pay for desalination, then “lack of water” becomes the problem.
This is pretty typical Texas response. Texans are actually pretty good at addressing a small scale issue right now. Gitter done mentality. What they fail at often is longer term issues that are not yet accute. Why solve a problem that doesnt need solved yet. And when that problem is larger in scale, its typically too big for gitter done approaches. Sounds exactly like the water problem on corpus christie.
Hope they fix the issue. One of my favorite beach locales is on mustang island across the causeway from corpus christie. Would hate to lose that vacation spot due to loss of water.
And not just oil.
Aluminum is up 25% from a year ago.
Soy beans, though still depressed by tariff retaliation, are up about 17% from the beginning of the year.
Urea is up 50% y/y.
Coal is up 18% from just before the attack on Iran and over 35% y/y.
Still, not all commodity prices are up; lumber prices are down from a year ago, despite a 45% tariff. Funny how that works.
TACO!:
https://www.yahoo.com/news/articles/trump-says-war-against-iran-193710203.html?
Oil and stocks trump Trump, every time.
Trump: “The war is very complete.”
Hegseth: “This war is just getting started.”
Trump: “You could say both.”
Schrodinger’s War
We may end up adding milk to the list of rapidly rising prices. This one is not directly the Mad King’s fault:
https://agroinformacion.com/en/marketseconomics/usda-triggers-secure-our-herds-alert-as-mandatory-2026-h5n1-dairy-testing-threatens-midwest-milk-margins/
Tighter scrutiny of H5N1 infections is a wise policy, but will end up cutting back on dairy production. Not clear how much output will drop, which is more or less the point. We have not, till now, been looking very hard for infected cattle.
It’s clear that the felon-in-chief wanted Iran’s populace to overthrow its government. But did he expect them to do so? Yes, they’ve been in the streets often, but they have also been pushed back out of the streets. If one engages in war casually, the answer may not matter in the choice to go to war, but it’s still a point if curiosity – did the felon actually think he could provoke a revolution?
Here’s a bit from Daniel Pipes Twaddle account from three days ago:
“The uprising in Iran in early January suggested an even greater insurgency would then follow on the U.S.-Israeli campaign to erode regime power. Yet, the populace now appears cowed into near-silence. This ranks as the most surprising and disappointing development of the past week. Without a new uprising, the regime will likely remain in power, less powerful but more awful than ever.”
Pipes long ago chose the path of activism over the path of clear thinking, but he swings a lot of weight with neocons, the press and even with war Democrats. Pipes thought Iran would careen into chaos is we bombed ’em for a week, the brutes in charge would be tossed aside.
To make that kind of claim beforehand could be disingenuous, merely an effort to start a war. To admit after the fact to being wrong sounds kinda like Pipes was smokin’ his own product.
Plan A was to incite a revolution, with the Kurds joining in. Plan B is to drift along without a plan. So we get a war that’s nearly over, but could go on for a lot longer, all in the same day. Great.
I don’t want to yell “fire” in a developing market theater, but a handful of already-weak currencies are being pounded by high oil prices and such. Here’s India’s rupee vs the USD:
https://www.google.com/finance/quote/USD-INR?window=MAX
Egypt’s pound:
https://www.google.com/finance/quote/EGP-USD?window=6M
It isn’t just EM currencies that are hurting. South Korea’s won has had some bad days, too:
https://www.google.com/finance/quote/USD-KRW?window=6M
The difference is, South Korea is unlikely to tip into a payments crisis. Sudden jumps in the price of oil often lead to payment stresses for developing economies.