We have alternative readings on employment, compared to CES series.
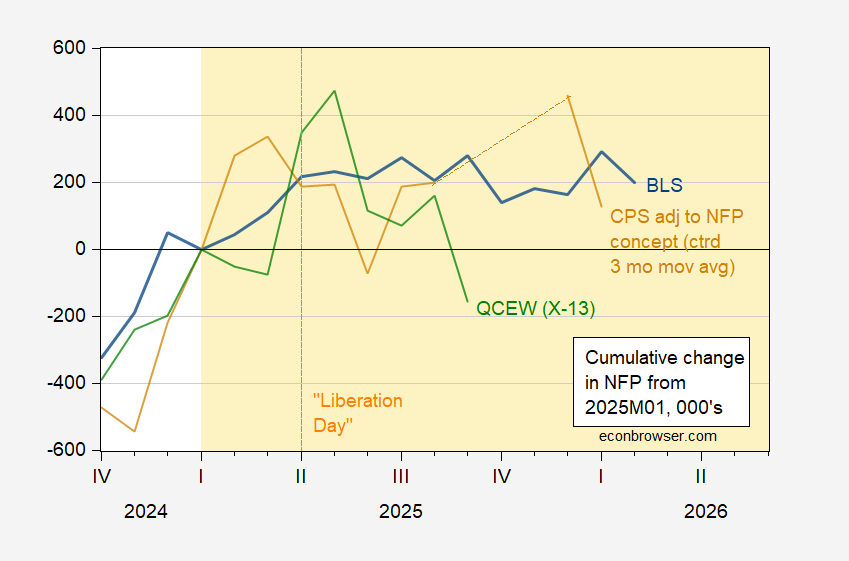
Figure 1: Change since 2025M01 in CES Nonfarm Payroll employment (blue), QCEW Nonfarm Payroll covered employment, seasonally adjusted by author using X-13 (green), and CPS employment adjusted to NFP concept (brown). Source: BLS via FRED, BLS, BLS/QCEW and author’s calculations.

Figure 2: Change since 2025M01 in CES Private Nonfarm Payroll employment (blue), QCEW Private Nonfarm Payroll covered employment, seasonally adjusted by author using X-13 (green), and ADP NFP (red). Source: BLS, ADP via FRED, BLS/QCEW and author’s calculations.
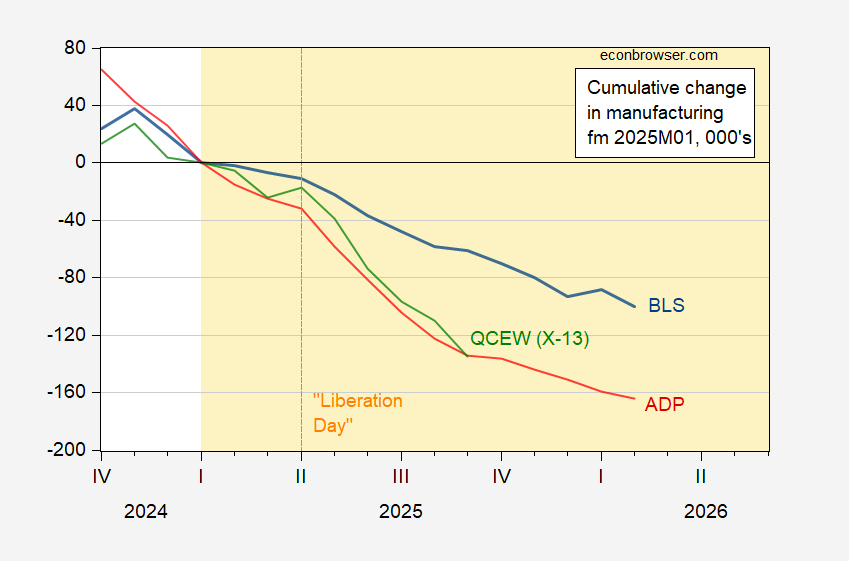
Figure 3: Change since 2025M01 in CES manufacturing employment (blue), QCEW manufacturing employment, seasonally adjusted by author using X-13 (green), and ADP manufacturing employment (red). Source: BLS, ADP via FRED, BLS/QCEW and author’s calculations.
If one is worried about the application of Census X-13 to aggregate employment, one can refer to year-on-year changes in n.s.a. QCEW series. Figure 4 shows this comparison for private nonfarm payroll employment.
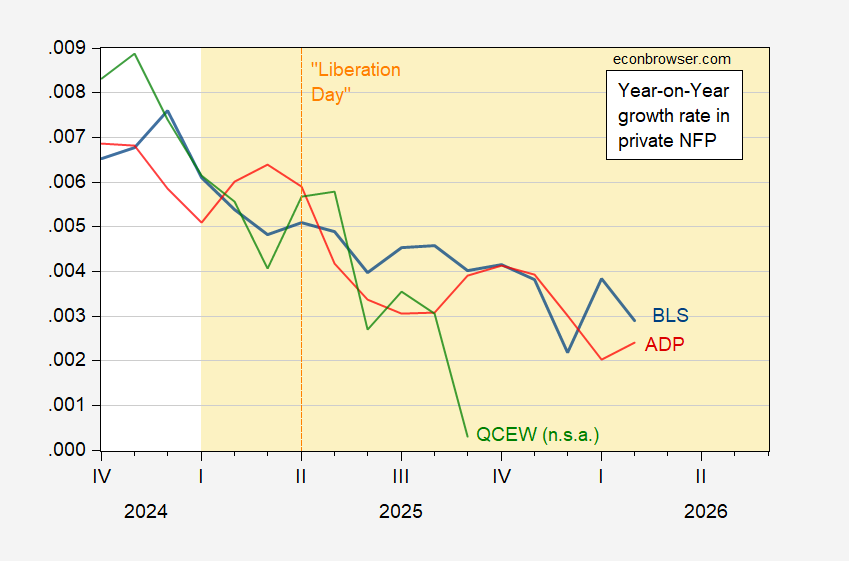
Figure 4: Year-on-Year growth rates in CES Private Nonfarm Payroll employment (blue), QCEW Private Nonfarm Payroll covered employment, n.s.a. (green), and ADP NFP (red). Source: BLS, ADP via FRED, BLS/QCEW and author’s calculations.
Bottom line: The census indicates employment in total NFP or private NFP have fallen relative to January 2025, as of September. This contrasts with CES based series indicating a modest increase.
Manufacturing employment as measured by the QCEW and ADP is decreasing faster than indicated in the CES series. That decline accelerated in the wake of “Liberation Day”.