Nominal retail sales grew 1.7% m/m, above Bloomberg consensus of 1.4%. With the advance release of sales, and coincident index from the Philadelphia Fed, we have the following picture.
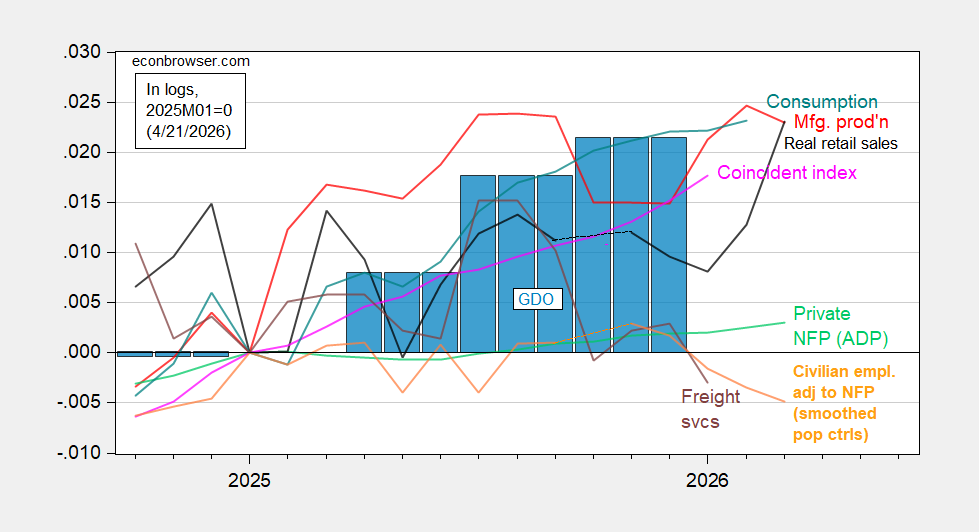
Figure 1: Implied Nonfarm Payroll early benchmark (NFP) (blue), civilian employment adjusted to NFP concept, using smoothed population controls (bold orange), manufacturing production (red), private NFP from ADP (light green), real retail sales (black), freight services index (brown), coincident index in Ch.2017$ (pink), and GDO (blue bars), all log normalized to 2021M11=0. Retail sales deflated by CPI. Source: Philadelphia Fed [1], Philadelphia Fed [2], Federal Reserve via FRED, BEA 2025Q4 advance release, and author’s calculations.
In order to include a real (inflation adjusted) measure of retail sales, I divided by the CPI. It’s not clear that this is the appropriate measure. As noted elsewhere, retail sales ex-gasoline does not exhibit the jump seen in total retail sales, maintaining the 0.6% m/m pace recorded in February.
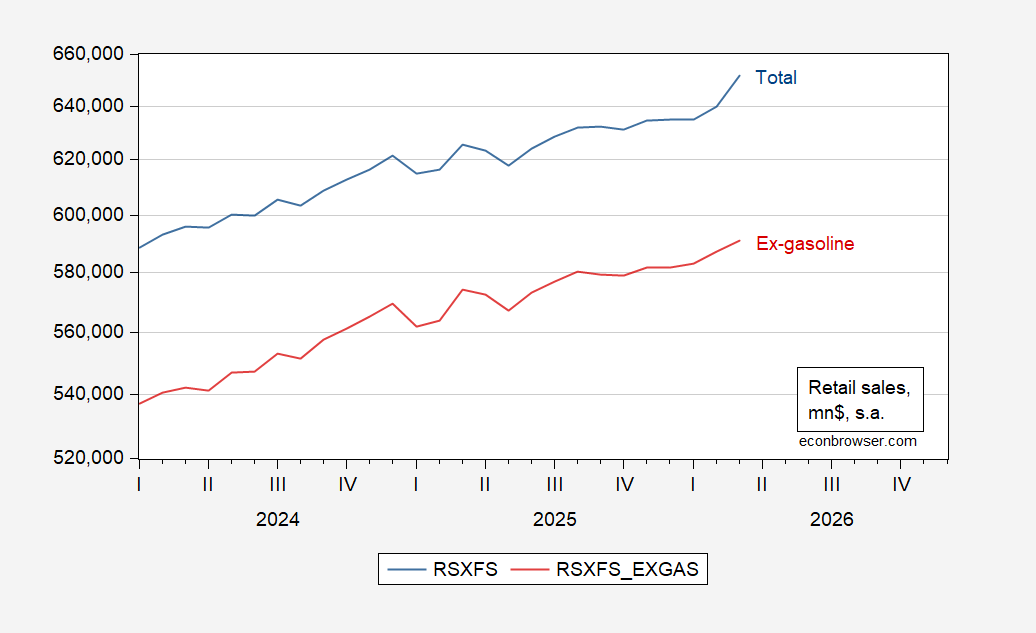
Figure 2: Retail sales (blue), retail sales ex-gasoline (red), both in mn.$, on log scale. Source: Census, and author’s calculations.
In March, consumers spend $8.1 billion more in gasoline stations than in February, a 15.5% m/m increase.
Hence, one would want to interpret the retail sales series with caution.
Gasoline hoarding.
So gas prices are up and demand is inelastic because they have no alternative — psychopath CEOs and their return to office BS. Folks gotta get to work somehow, so they just go farther into debt trying to maintain their current standard of living. Sales are up but it’s just making the oil moguls richer and everyone else poorer.
Early Easter was the main distortion besides fuel. Off it will come in April. Less sampling days and another inflation bite..
I think your second graph is in nominal terms. When I divide retail sales ex-gas by CPI, while there is a m/m increase, the number is still -0.2% below last August’s peak.
New Deal Democrat: Yes, second graph is indeed in nominal terms. Not sure I should divide retail sales ex gasoline by headline CPI which includes gasolinne…
Deflating by CPI less energy I still get the same result:
https://fred.stlouisfed.org/graph/fredgraph.png?g=1V2EW&height=490
Hey, Antoni divides GDP by CPI so it must be okay.
He’d divide GDP by wind speed if it gave him the result he wants.
Off topic – explaining stock market resilience to recent shocks:
https://cepr.org/voxeu/columns/explaining-puzzle-high-policy-uncertainty-and-low-market-volatility#:~:text=This%20column%20argues%20that%20the%20US%20market,from%20the%20new%20administration%20has%20been%20unreliable
The authors argue that the crazy-ass nature of policy under the felon-in-chief has led investors to focus on the longer-term earnings outlook when pricing equities. What cannot be understood cannot be priced in, so ignore it. This, the authors argue, also happened during the first felon administration.
Well, I guess that’s as good an explanation as any, but that doesn’t mean it explains much. The P/E ratio for the S&P500 is still twice the historical median:
https://www.multpl.com/s-p-500-pe-ratio
It’s probably obvious, but I’ll mention it anyway – ignoring shocks that are hard to evaluate doesn’t match up well with claims that markets quickly price in available information. The claim here is more like “markets price in information which is easy to assess” or “information which fits in our model”. Given what we learned during the housing boom, this is not far fetched.
This paper joins the chorus claiming that markets are mispricing equities. That is a constant theme these days, heard daily on Marketace Radio, from author Kyla Scanlon (of “vibecession” fame) and many others. The authors of this study, Scanlon and many others claim they know WHY markets are mispricing equities; that’s just pundits being pundits. At least Marketplace has avoided that bit of hubris.
I think the ping ponging of events and policies makes it very hard for the market to reach an equilibrium. if every other day there is a ceasefire on and then off, a blockade on and then off, a tariff on and then off, it makes the market get sloppy. now I would expect a sloppy market would fall in price, but maybe that assumption is wrong. but I think major events are happening faster than the market can properly digest. and I am beginning to think there may be some type of market manipulation going on, but have no evidence so at this point just conspiracy theory stuff.
on the other hand, I am now petrol free, although my better half still has a 6 mile round trip commute burning the stuff. but my last fillup was for premium gas a $5.50/gallon. at that price, I save over $1500 per year compared to my electric bill.