The President’s FY2027 budget was released yesterday, some two months late.
The economic forecast, based on data available in November, is out of line with other forecasts based on contemporaneously available data. And in fact, at 3.5%, 2026 q4/q4 was upped (!) from 3.2% in the Mid-Session Review.
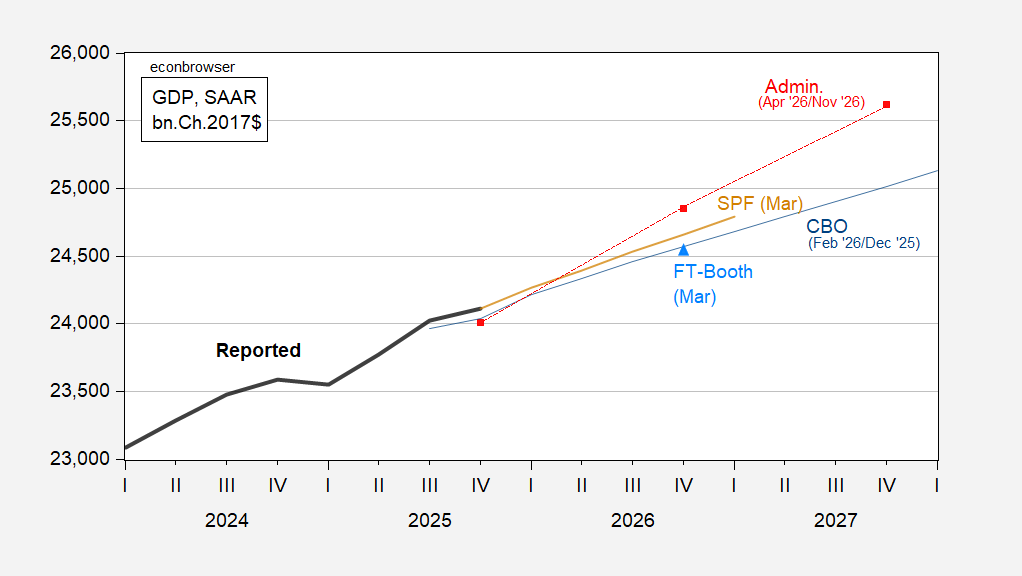
Figure 1: GDP (bold black), February CBO (blue), April Admin. (red square), March Survey of Professional Forecasters (brown), March FT-Booth (light blue triangle), all in bn.Ch.2017$ SAAR. Source: BEA, CBO, OMB, FT-Booth, Philadelphia Fed, and author’s calculations.
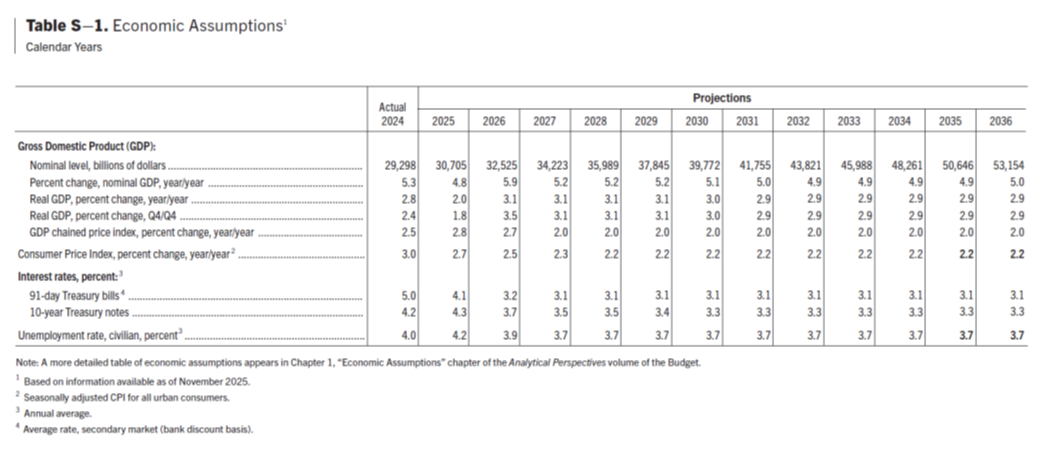
Here’s a summary table from the Budget:
I think (I’m guessing here) the professional staff members in OMB, CEA and Treasury were trying their best to convey the extent to which there was some magical thinking in the GDP forecast — even based on November data and information (pre-Greenland, pre-War).
From the Analytical Perspectives:
Economic Projections
The Administration’s economic assumptions for the 2027-2036 budget window inform the 2027 Budget and assume implementation of the Administration’s policy proposals. The Administration’s projections, which were finalized in early November 2025, are reported in Table 2-1 and summarized below. The overall picture of this forecast is one of a robust and thriving economy: strong overall economic growth is paired with a low unemployment rate and stable (on-target) inflation. Real GDP. The Administration’s economic assumptions project real GDP growth of 3.5 percent over the four quarters of 2026. Real GDP growth is then expected at 3.1 percent per year during the three years 2027-29, and to average 2.9 percent over the remainder of the forecast horizon
…
Comparison with Other Forecasts
This section compares the Administration’s forecast with contemporaneous forecasts from CBO, the FOMC, and the Blue Chip panel of professional forecasters.
There are important methodological differences across these forecasts. Aside from the inherent uncertainty of forecasting economic variables, different projections make different assumptions about which policies of the Administration will be enacted. The Administration’s forecast assumes implementation of the Administration’s proposed policies such as deregulation, energy abundance, reindustrialization, etc. In contrast, the CBO forecast assumes no changes to current law. It is unclear to what extent FOMC members or Blue Chip panelists incorporate policy implementation expectations into their respective outlooks. The Blue Chip panel comprises a large number of privatesector forecasters, who have different expectations about the enactment of the Administration’s proposed policies and different views about how those policies might affect economic growth.
A second key difference is that the various forecasts were published on different dates. For example, while the forecast published by the Administration is based on data available as of early November 2025, the Blue Chip forecasts are drawn from a survey administered in early October. In addition, both the Federal Reserve’s FOMC projections and the CBO forecast were published in September.
Real GDP. The Administration forecasts an average real GDP growth rate of 3.0 percent (fourth-quarter-over fourth-quarter) during the 11 years from 2026 to 2036. This forecast is significantly higher than the forecasted growth rates of the Blue Chip consensus, the median FOMC member, or the CBO over the same forecast window. Over the coming year, the Administration forecasts a 2026 growth rate of 3.5 percent, which is above the 1.8 percent Blue Chip average and the FOMC median, and also above the 2.2 percent forecast from CBO.
Analytical Perspectives Table 01-2 compares in tabular form the forecasts. Here for comparison in graphical form is the IMF’s forecast from October, and the Survey of Professional Forecasters November survey median.
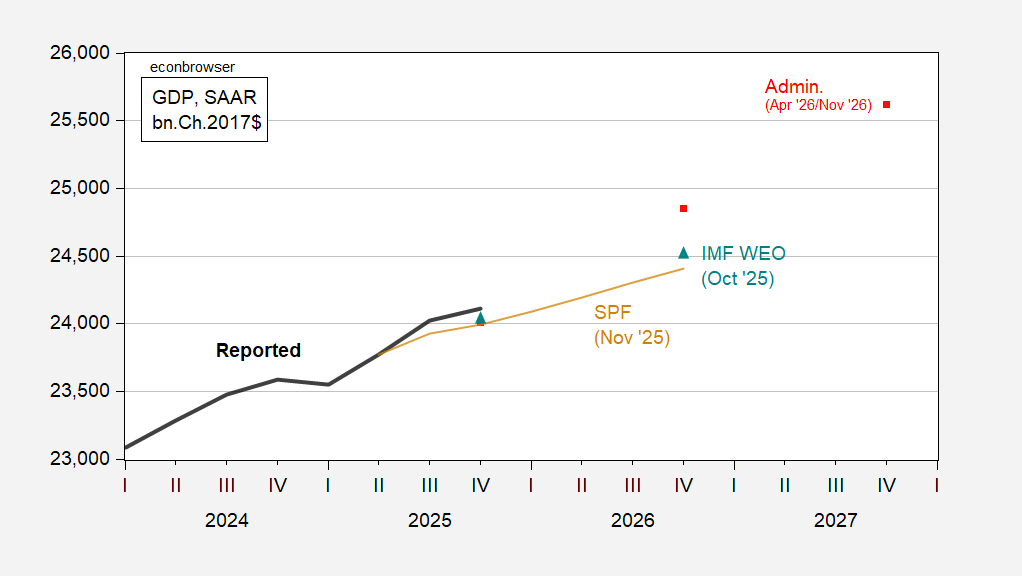
Figure 2: GDP (bold black), April Admin. (red square), November 2025 Survey of Professional Forecasters (brown), IMF October WEO (teal triangle), all in bn.Ch.2017$ SAAR. Source: BEA, OMB, IMF WEO October update, Philadelphia Fed, and author’s calculations.
Of interest is the sensitivity of revenues, expenditures to the growth (and other) forecasts. Table 01-3 (excerpt) below summarizes the revenue/expenditure aspects.
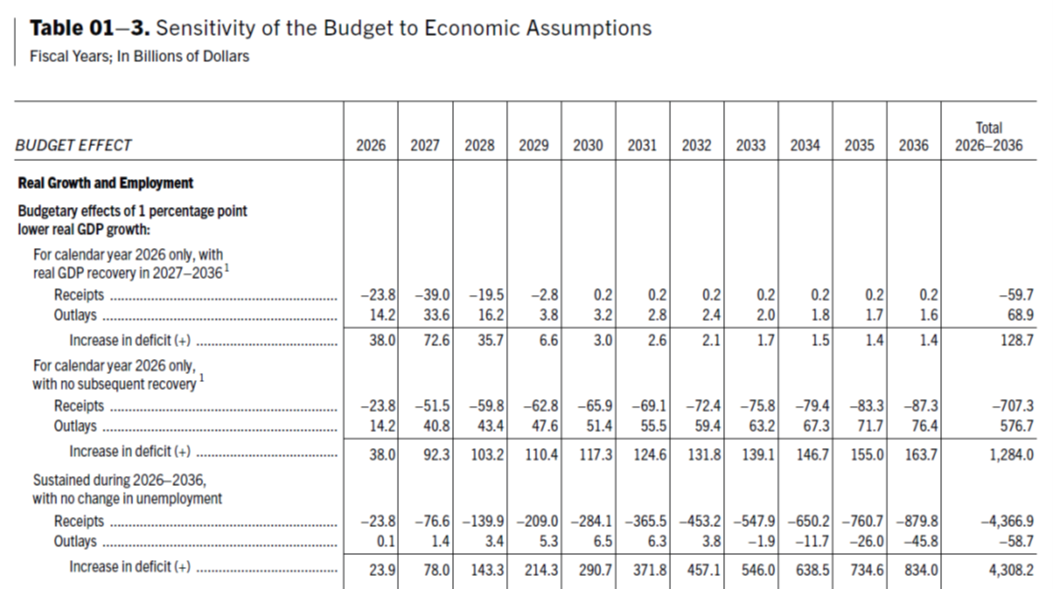
The -$72.6 bn increase in primary deficit for CY2027 assumes one percentage point reduction in growth in 2026 with a makeup in GDP in 2027. It’s hard to make out exactly what the Administration means by “a recovery”, but I read it as a return to pre-drop trajectory. To quote (page 8):
For real GDP growth and employment: ·
- The first panel in the table illustrates the effect on the deficit resulting from a one percentage point reduction in real GDP growth, relative to the Administration’s forecast, in 2026 that is followed by a subsequent recovery in 2027 and 2028. The unemployment rate is assumed to be half a percentage point higher in 2026 before returning to the baseline level in 2027 and 2028.
- The next panel in the table reports the effect of a reduction of one percentage point in real GDP growth in 2026 that is not subsequently made up by faster growth in 2027 and 2028. Consistent with this output path, the rate of unemployment is assumed to rise by half a percentage point relative to that assumed in the Administration’s forecasts.
- The third panel in the table shows the impact of a GDP growth rate that is permanently reduced by one percentage point, while the unemployment rate is not affected. This is the sort of situation that would arise if, for example, the economy was to experience a permanent decline in productivity growth.
Hence, Panel 2 sounds more realistic to me (2.5% q4/q4 growth in 2026, 3.1% thereafter). I look forward to the 2027 Economic Report of the President which will explain the basis for the 3.5% growth (by law it’s to be released within 10 days of submission of the budget).
For co text, here’s recent real GDP growth and the CBO projection of potential growth over the next decade:
https://fred.stlouisfed.org/graph/?g=1UsZ7
CBO puts potential growth this year at 2.2%, falling to 2.0% as of 2030, and below 2.0% from then on. For most of that 10-year period, the troika forecasts growth 1% or more above the CBOs estimate of potential.
Tariffs, policy uncertainty, constraints on the growth of the labor force, high energy, fertilizer and aluminum prices, scuttling alternative energy investment and erosion of the rule of law all tend to raise growth potential? Right.
if he follows up with the action, then he is guilty of premeditated war crimes. this will give him greater incentive to do whatever it takes to remain in office. if he leaves office in a few years, he will be vulnerable to a war crimes trial. if he remains dictator for life, that issue is off the table. very problematic for the future of the usa.