A SEACEN research paper, Hiro Ito, Project Team Leader:
From Chapter 1, “US Dollar Dominance in the Global Economy, by Cyn-Young Park and Hiro Ito:
…
3. Measuring Dollar Dominance Dollar Dominance in International Trade
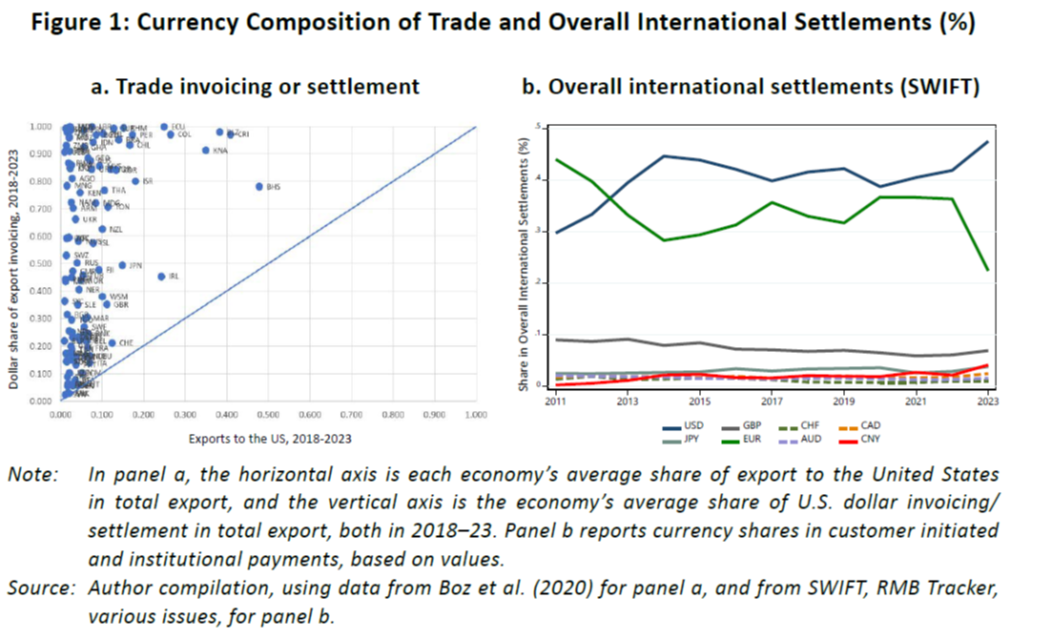
The most prominent role of the USD is for trade invoicing or settlement. Gopinath (2015) points out the dollar’s outsized role in invoicing half or more of international trade. Figure 1a illustrates the shares of the dollar in export invoicing or settlement for individual countries (y-axis) compared to the shares of their total exports that are destined for the United States (x-axis). The figure demonstrates how economies rely more on the dollar for international trade than their trade relationships with the United States might suggest. If the dollar did not play a dominant role, one would expect its invoicing/settlement share in export transactions of economies to be proportional to the share of the United States as a destination for an economy’s exports. The figure clearly indicates that economies invoice or settle their exports in the dollar much more than proportionally in line with the share of their exports to the United States.
Source: Author compilation, using data from Boz et al. (2020) for panel a, and from SWIFT, RMB Tracker, various issues, for panel b. Figure 1b shows the currency composition of all international settlements reported by Society for Worldwide Interbank Financial Telecommunication SC (SWIFT). It is clear that the dollar is most widely used for international settlements, followed by the euro, while other major currencies such as the UK’s pound sterling and the Japanese yen are far less important. Although the dollar is the most important international settlement currency, it is not so dominant and was actually less important than the euro in the early 2010s. Since then, the euro has been a strong second most important international settlement currency.
International Currencies in Foreign Exchange Trading and as Foreign Reserves
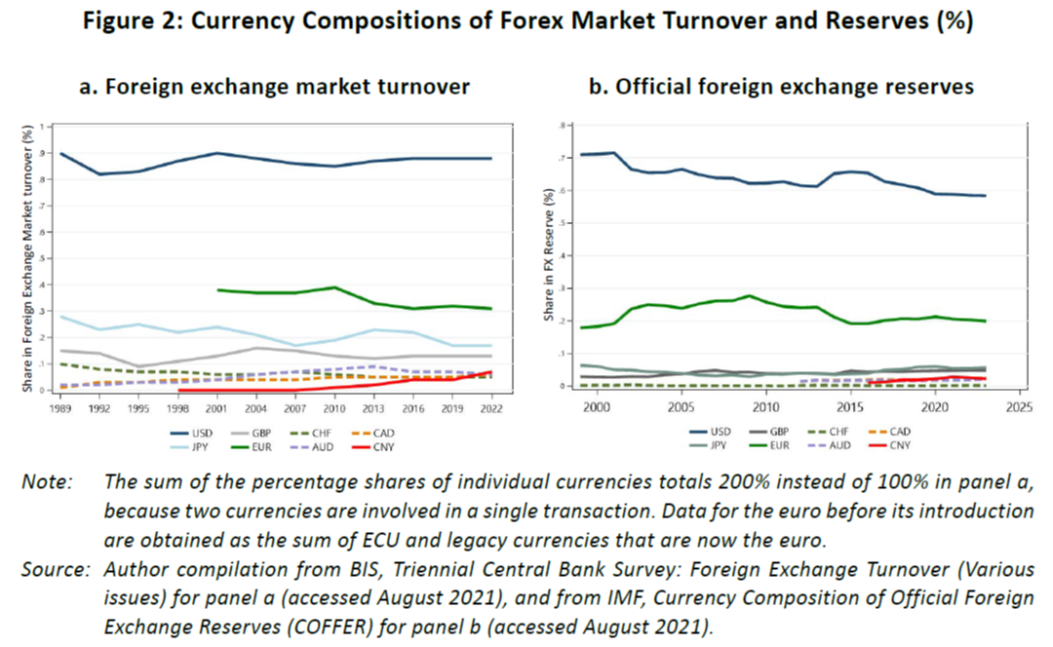
Figure 2a summarises the currency composition of foreign exchange trading in the world’s major markets from 1989 to 2023, based on the triennial survey of the Bank for International Settlements (BIS). The figure indicates the USD is used in 80–90% of foreign exchange trading over the past 30 years, recording 88% in 2024. The euro share has slipped from 38% in 2001 to 32% in 2022, perhaps due to the Euro Area debt and banking crisis in 2011–2015. The share of the yen also fell from 27% in 1989 to 17% in 2022, a level below the previous trough in 2007. That share is still higher than for pound sterling, which was 13% in 2022. The share of the Chinese renminbi in the global currency markets has risen since the mid-2000s, and reached 7% in 2022.
Figure 2b reports the currency composition of foreign exchange reserves held by all IMF reporting member countries. It shows that the share of the USD has been relatively high at 50-70 % as the primary reserve currency, recording 58% in 2024. The share of the euro has been in the range of 20-30% and registered 20% in 2024. The shares of other reserve currencies have been very low in comparison to those of the dollar and the euro. The share of the yen has been at the 4–9% range and recorded 6% in 2024, but the yen still occupies the third position. The pound sterling continues to play a role as a reserve currency, accounting for 5% in 2024. The RMB is the only emerging economy reserve currency which was included in the IMF’s special drawing rights basket in 2016, accounting for 2% of global FX reserves in 2024. Thus, the RMB is not yet one of the major global reserve currencies, although its share is now higher than those of the Canadian dollar, Australian dollar, and Swiss franc.
U.S. Dollar Dominance in the Global Economy International Currencies for Cross-border Bank Loans and Debt Securities
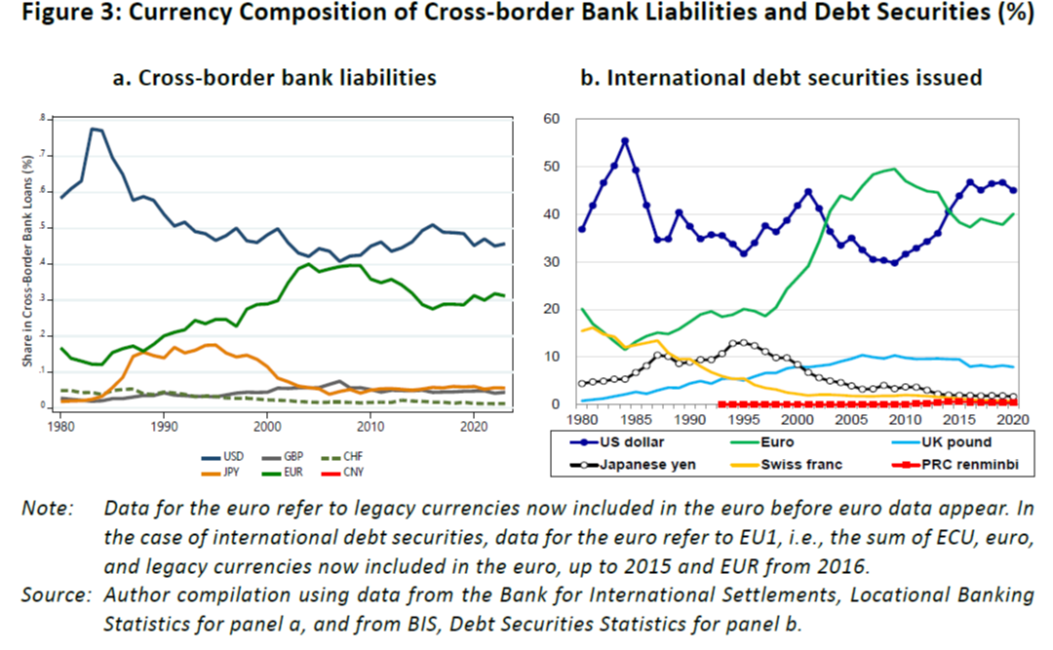
Figure 3a presents the currency composition of cross-border bank liabilities based on BIS locational banking statistics. It shows that the share of the USD was in excess of 60% in the early 1980s, and while this began to decline in the latter half of the 1980s, it has still maintained a 45–55% share over the last 30 years, reaching 48% in 2024. The euro share is the second highest and appears to have risen over time, at 31% in 2024. The share of the yen was low in the early 1980s, began to rise in the second half of that decade, maintained moderately high use at more than 10% in the 1990s but has declined since then, falling to 3% in 2024, which was slightly less than the pound sterling share. No data are reported for the renminbi.
Figure 3b presents the currency composition of the stock of international debt securities issued. It shows that the share of debt issued in euros was higher than for the dollar between the early 2000s and the early 2010s and overtaken by the dollar in the mid-2010s. In recent years, the dollar’s share was high but not dominant at 46% while the euro’s share was 40% in 2024. The share of the yen was moderately high in the mid1990s, at close to 15%, but declined to a mere 1% by 2024. The pound sterling share has been higher than the yen share since the early 2000s, at 8% in 2024. The renminbi share has remained low at less than 1%, at 0.8% in 2024.
Dominance of the U.S. Dollar Zone
In the empirical international macroeconomics literature, many researchers have tried to estimate the extent to which an economy tries to stabilise its currency against major currencies. Those estimates can be essentially regarded as weights in currency baskets. By aggregating the weights across economies, the shares of major currencies (i.e., the USD, EUR, GBP, JPY, and RMB) can be used to estimate the economic size (e.g., GDP) for each currency zone. In this paper, we use the economic currency zones from Ito and Kawai (2025).2
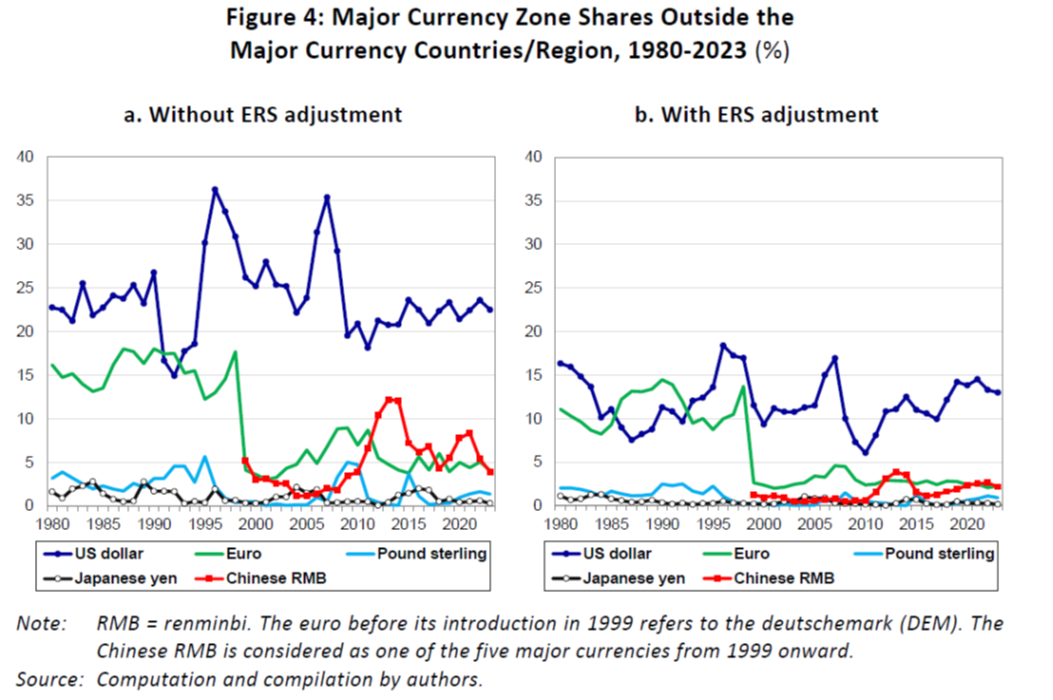
Figure 4 depicts the computed shares of currency zones formed by the USD, EUR (or DEM until 1998), GBP, JPY, and RMB, outside the major currency countries or regions. This means that the core countries of currency zones are excluded. Figures 4a and 4b show currency zone shares without and with adjustment for ERS, respectively, where ERS represents to what extent an economy of concern stabilises its exchange rate against a major currency or a basket of major currencies in a tight or loose way.3 Not surprisingly the currency shares are higher or at least not lower in Figure 4a than in Figure 4b. The USD zone share is the highest except for the short period up to the early 1990s when the EUR (more precisely DEM) zone share exceeded the USD zone share. This happened because many European countries as well as other economies in the rest of the world stabilised currencies against the DEM and the total size of these economies exceeded the size of USD zone economies. The EUR zone share declined sharply from 1998 to 1999 as 11 European countries, which had more or less stabilised currencies against the DEM, formed the Euro Area as core countries. The global share of the EUR zone economies outside the Euro Area has not risen much since then, at around 5%. Another striking observation is that the RMB zone has grown since the global financial crisis and sometimes exceeded the size of the EUR zone. In 2023, the RMB zone is roughly comparable to the euro zone at 3% in relative economic size. 2. See Appendix I of Ito and Kawai (2025) for more detailed explanation of the Frankel-Wei and KawaiPontines methods. 3. The ERS index is constructed by normalising the root mean squared error (RMSE), which is inversely related to the explanatory power of the Frankel-Wei or Kawai-Pontines regression equation, so that its value ranges between zero (complete currency flexibility) and unity (complete currency pegging).
…
Just a thought.
There is a cost to foreign exchange trade. The lowest-cost trade ifor most currencies is agaimst the dollar. The cost differential is often so great that it’s cheaper to do two trades, one into dollars and the second from dollars to the home currency, than a single trade between two non-dollar currencies.
Seems likely that the decision to invoice trade in dollars, and to borrow in dollars, is partly driven by this cost advantage.
A second consideration, growing partly out of the low cost of transacting in dollars, partly out of various credit issues (safety, liquidity, rate of return), is that dollar deposits are widely used for short-term storage of cash. If I sell iron to China for dollars, and have payments due in a week in Indonesia, I can hold a short-term deposit in dollars or in rupiah. Sometimes, I’d choose dollars.
Low transaction cost and availability of deposits creates a self-perpetuating element to the popularity of dollar transactions.
China and Iran may arrange to transact Hormuz tolls in yuan, but that doesn’t increase the relative cost or decrease the relative convenience of transacting trade in dollars; you do that by lowering the cost of transacting in yuan and making yuan deposits cheap, safe, remunerative and available. An open capital account and a sizable current account deficit look like a first step to partly supplant the dollar in trade, because those conditions would tend to lower the cost of yuan FX transactions, and to make overseas yuan accounts more common.
Apparently, the U.S. Navy has been instructed to commit piracy?
https://www.yahoo.com/news/articles/trump-says-directing-us-navy-130232368.html
One tantrum after another.