Everyday prices outstripping measured CPI and subindices:
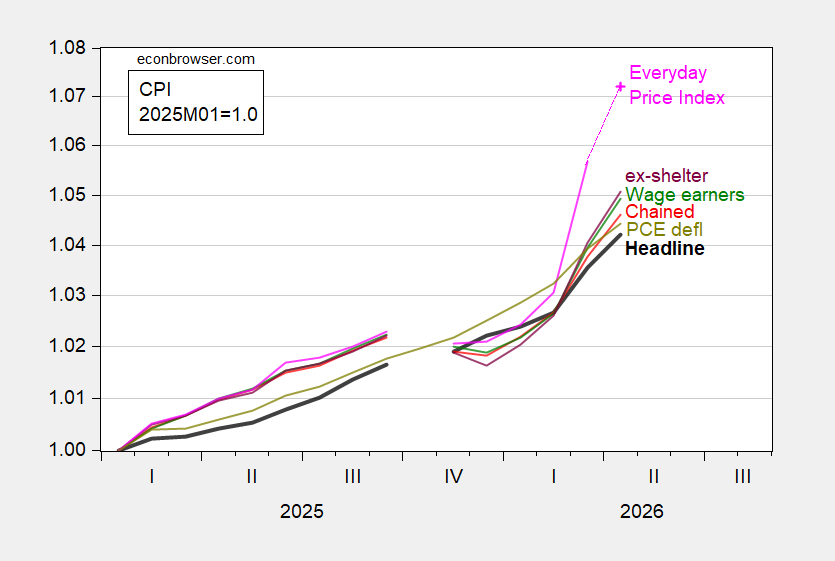
Figure 1: CPI-all urban (bold black), CPI wage earners and clerical (green), CPI ex-shelter (purple), CPI chained (red), PCE deflator (chartreuse), AIER Everday Price Index (pink), all 2025M01=1.0, on log scale. Chained CPI is n.s.a. April AIER EPI is nowcasted using gasoline price changes. April PCE deflator is nowcasted as of 5/11. Source: BLS, BEA via FRED, AIER, Cleveland Fed, and author’s calculations.
AIER has not yet reported the Everyday Price Index for April. I nowcast EPI usign a EPI-gas price regression that has an adjusted R2 of 0.87, SER of 0.002, with a statistically significant coefficient of 0.10 (each 1% increase in gasoline prices is associated with a 0.1% increase in the AIER EPI).
Core has also accelerated, with the exception of supercore (CPI ex food, fuel and housing).
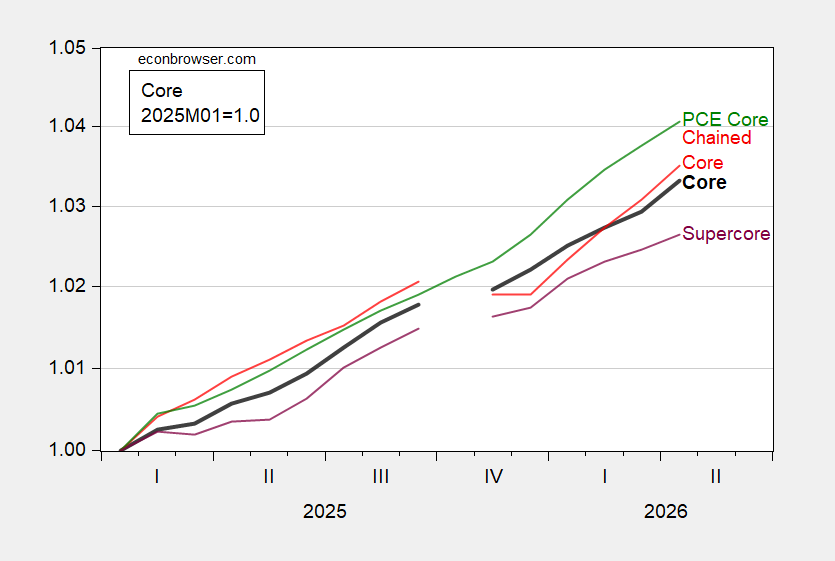
Figure 2: Core CPI-all urban (bold black), CPI chained core (red), CPI supercore (purple), PCE core deflator (green), all 2025M01=1.0, on log scale. Chained CPI is n.s.a. April PCE core is nowcasted as of 5/11. Source: BLS, BEA via FRED, BLS, Cleveland Fed, and author’s calculations.
Off topic – UK rates:
https://tradingeconomics.com/united-kingdom/government-bond-yield
Eveey time UK rates riae in response to some new political development, the next political development pushes ’em higher still. A Tory crazy lady came to power and rates rose. Labour came to power and rates rose. Now, Labour and the Tories both get spanked in regional elections and rates rise. This looks like a problem.
Oh, to live in a country so well governed that politics don’t have much effect on interest rates.