Not standard NBER BCDC indicators, but still interesting. First, all measures of personal income (pretax, aftertax) are down while consumption growth slows.
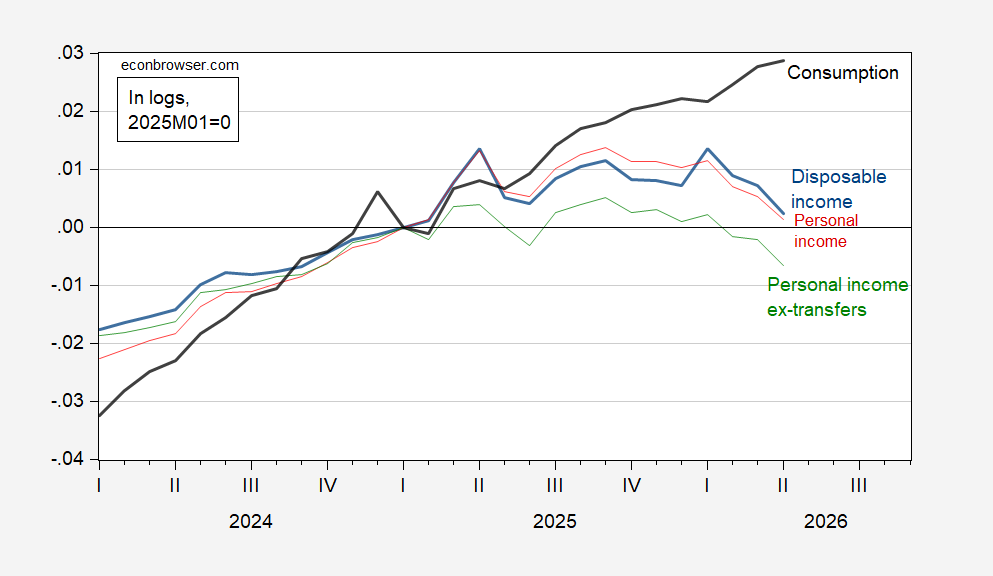
Figure 1: Consumption (bold black), disposable personal income (bold blue), personal income (red), and personal income excluding current transfers (green), all in logs, 2025M01=0. Source: BEA.
Second, aftertax corporate profits with inventory valuation adjustments and capital consumption allowances are down in Q1, at -0.4% m/m vs. 5.7% consensus. That strikes me as a miss.
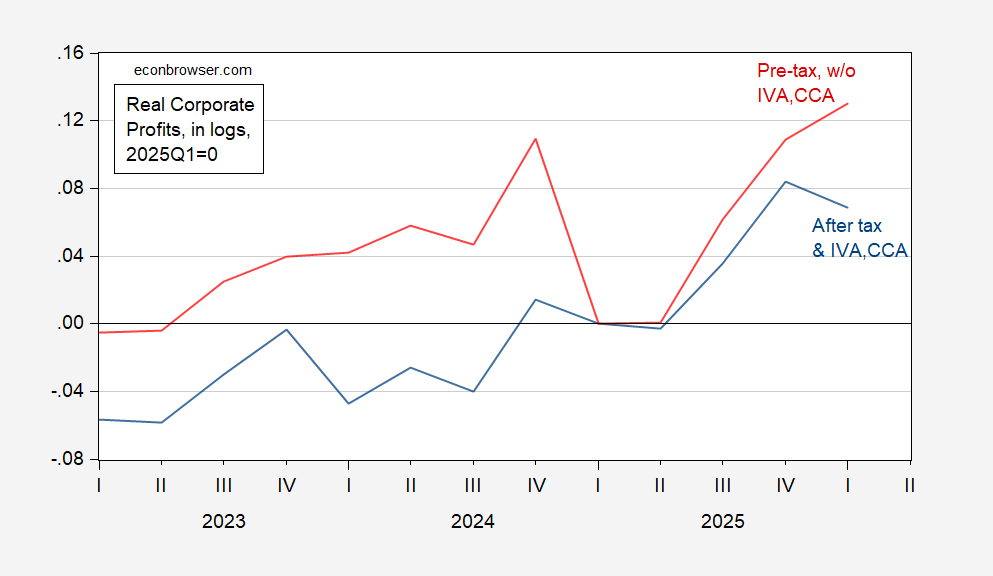
Figure 2: Pretax corporate profits, w/o IVA, CCA (red), and aftertax corporate profits, with IVA, CCA (blue), in 2017$. Source: BEA.
While aftertax profits are down, they are at or above trend.
In sum, real personal income is down. Corporate profits through Q1 too, but at or above trend.
Off topic – Brookings has published an estimate of the buffer provided against the current oil supply shock by the drawdown of floating inventories and release of oil from strategic reserves. The upshot is that floating inventories are finished right about now and that strategic reserves will run out early in July, with July currently the front-month contract. Here’s the gist:
“Russian floating stocks, with an estimated average of 1.6 mb/d buffer beginning March 12, are depleted by the end of April; similarly, Iranian floating stocks, with an estimated average of 1.3 mb/d buffer beginning April 13, are depleted by the end of May. The emergency oil release from IEA members beginning March 11 and depleting by July 9 provides a buffer of 2.5 mb/d. Thus, by the middle of July, the full extent of temporary buffers will have been exhausted, with an overall market adjustment of 7.1 mb/d, roughly 16% of global crude oil trade, needing to be absorbed.”
The world had a supply glut going into the war, or we’d be in worse shape now. U.S. inventories excluding the SPR are still up about 25 million barrels from December, but are down about that much over the past 5 weeks. In the current environment, 25 million barrels can go pretty fast. China has also provided a big inventory buffer, but seems to be running low.
Brent is down 10% over the past five days, WTI down 8%, apparently on the assumption that peace is about to break out in the Persian Gulf. Oil market professionals know all about floating inventory and SPR releases, so what Brookings has published is no secret to them. What they do not know any better than the rest of us is the prospect for opening the Strait of Hormuz. And yet, knowing that a 1.3 mb/d increment of supply is ending right now, and another 2.5 mb/d will end after the first week in July, prices remain lower than last week, when the White House started talking up a peace deal. Since then, I can’t find much evidence of progress, and we’ve bombed Iran two days in a row during this ‘ceasefire”. Also, for fans of the “Hajj headfake” story, the Hajj ends on Saturday.
bloomberg radio has consistently said that sometime in June is when the storage realistically dries up and we start to deal with physical scarcity. I am quite surprised by the drop in oil prices. I have also noticed gasoline prices in houston have dropped about 50 cents in the past couple of weeks. curious if people are cutting back on gas and oil consumption? or is trump effective at bullying the price down? I expected Memorial Day holiday to have high prices, but did not really observe that. and this is why I stay clear of any oil trades. not predictable on my end.
One more detail. There is a substantial floating inventory trapped in the Persian Gulf. The assumption of a near-term peace deal includes the assumption that something like 175 million barrels will come on the market over the period of a few weeks. That’s only slightly more than would exit Hormuz in normal times, but it’s more than is exiting now.