Using today’s CPI release:
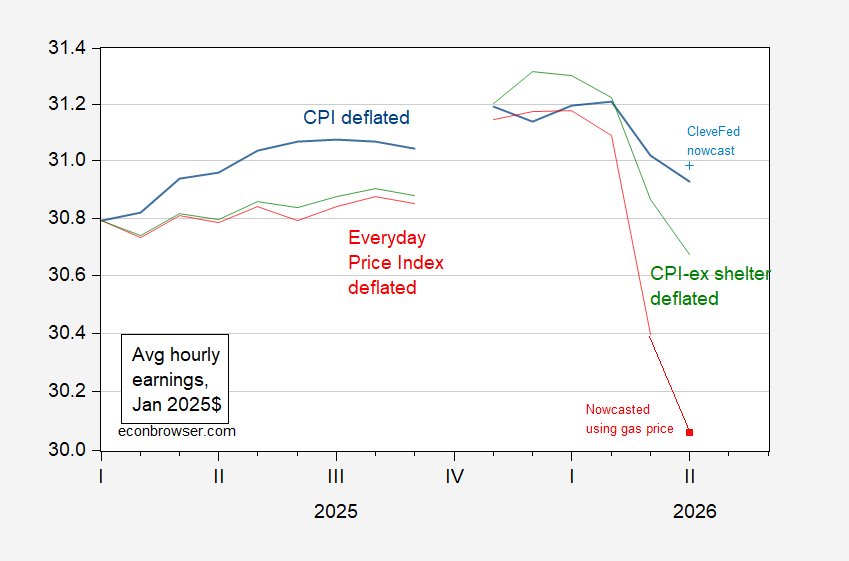
Figure 1: Average hourly earnings deflated by CPI (blue), Cleveland Fed nowcast as of 5/11 (light blue +), by CPI-ex shelter (green), by AIER’s “Everyday Price Index” (EPI) (red), both in January 2025$. AIER EPI for April is obtained from a 2023M04-2026 regression of log first differences of EPI on gas prices. Source: BLS, EIA via FRED, AIER EPI, and author’s calculations.
The reported April CPI exceeded the Clevelad Fed nowcast, though matched Bloomberg consensus. There was an aspect of the way the BLS handled the rent component during the shutdown which pushed upward the CPI; hence, I also plot CPI ex-shelter. This has fallen even more over the past months so that the real wage so defined is even lower than at the beginning of Trump administration 2.0.
AIER has not yet reported the Everyday Price Index for April. Relying upon the nowcasted EPI, I find the real wage much lower than 2025M01. The EPI-gas price regression has an adjusted R2 of 0.87, SER of 0.002, with a statistically significant coefficient of 0.10 (each 1% increase in gasoline prices is associated with a 0.1% increase in the AIER EPI).
Debt service as a share of disposable income stood at 11.3% as of Q4:
https://fred.stlouisfed.org/graph/?g=1WaDz
That’s the highest share since before Covid, and we have we have assurances from Kevin Hassett that credit card debt has risen rapidly since then. And that’s a good thing! (sic)
Consumers are generally slow to change spending patterns, relative to changes in income. That’s not mere stubbornness; we lock in a big chunk of spending with rent contracts, mortgages, car loans, insurance contracts, children…
Borrowing provides a way to adjust to changes in (real) income, but adds to the chunk of locked-in spending. The burden if debt service also rises all by itself, whenever intetest rates rise. Here’s the average rate on credit card debt:
https://fred.stlouisfed.org/series/TERMCBCCINTNS
The latest reading, for February, was 21.52%.
You see where this is going. Slow job growth, falling real income and a rising debt burden combine to stall spending growth. That stall has already happened for middle and lower-income families; the top 20% are carrying retail spending, and have been for some time. Once credit card limits become binding, lower and middle-income households cut back but keep paying 21.5%.
The guy who calls himself “the king of debt” said he was going to get credit card rates down, but so far he hasn’t, and he seems to have lost interest.
He also promised lower prices, a replacement for Obamacare, a solution to the housing shortage, a resurgence in factory jobs, China buying boatloads of soybeans, “infrastructure week”… Still waiting on those, too.
A lot of people have noted that real wages turned negative YoY this month. But there is an even better similar indicator with a near perfect record going back 60 years: real aggregate nonsupervisory payrolls.
Without exception, they always – and almost only – turn negative YoY at the outset of recessions. Here is their entire record YoY, plus that of real aggregate total payrolls:
https://fred.stlouisfed.org/graph/fredgraph.png?g=1Wayr&height=490
The only potential false positive was in 2002. They also came close, for one month each, in 1968 and 1996.
Further (I’ll let readers manipulate the graph to show this) in absolute terms rather than YoY, with the exception of 1981, they always peaked a few months before the recession started. The average decline from peak till onset of recession has been -0.7%.
The nonsupervisory series peaked in January, and is now down -0.4%. Further, it is only higher YoY by 0.7%. If you believe as I do that the way the Census Bureau handled shelter inflation during the shutdown undercounted it by about 0.5%, and headline inflation by about 0.2%, then the YoY comparison is now only about +0.5%.
Close enough for a yellow flag “recession watch” for me.
Finally, note that it is a fundamentals-based indicator. If in the aggregate ordinary workers have less to spend, they will start pulling back. And less consumption if it lasts leads to recessions.
Adjacent topic – the Iran war calendar:
The U.S. is piling up air power near the Persian Gulf.
Negotiations between the U.S. and Iran now amount to an angry shouting match – Pakistan’s intermediation isn’t being used.
The war-criminal-in-chief is on his way to China, a trip which may be the only thing preventing renewed bombing of Iran now. China has reason to push for reopening Hormuz, which can only happen on terms favorable to Iran.
I don’t know what happens next, but I kinda think the ceasefire-with-shooting is about to end. Change is coming aoon.
Y’all know about Nero, right? A privileged brat who avoided military service and pranced around on stage, demanding praise for his performances? Became emperor and then may have destroyed a part of the Empire’s capitol city to clear the way to expand his palace? That guy.
Can’t think what brought him to mind.