The odds of the Strait of Hormuz re-opening by July 1st is at all time lows; and yet the front month (July) Brent is at only $111.
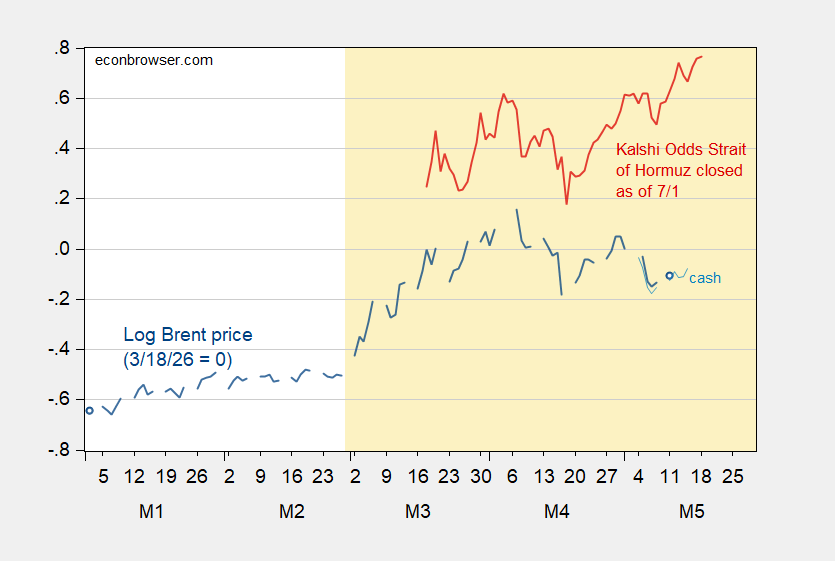
Figure 1: Brent spot price, in logs 3/18/2026=0 (blue), cash price (light blue), and odds of Strait of Hormuz remains closed as of 7/1/2026 (red). Source: EIA via FRED, NYMEX via barchart.com, Kalshi.
Given the correlation up to 4/27, one would’ve expected a higher Brent price (spot is graphed above, but using front month futures would yield a similar picture). One possibility is that oil prices are responding to other information regarding the likelihood of oil flow resumption, such as kinetic actions. I add in a proxy for the intensity of military action, namely the Caldara et al. Geopolitical Risk – Action index (GPR_Action).
priceoil = 4.76 + 0.217CLOSED + 0.0003GPR_Action
Adj-R2 = 0.15, SER = 0.153, DW = 0.89, NObs = 36, sample 3/18-5/11. bold denotes significant at 5% using HAC robust standard errors.
The equation still underpredicts oil prices by about $10 on 5/11.
One interesting point is that Kalshi odds for re-opening barely budged when Trump stated today (BBC):
“They better get moving, FAST, or there won’t be anything left of them. TIME IS OF THE ESSENCE!”
Nonetheless, in overnight trading, July Brent did rise about $2.40, before dropping to a $1.90 increase by midnight ET.
“The markets can stay irrational longer than you can stay solvent.”
Also: “A boy can cry wolf long before the sheep get eaten.”
The boy-in-chief twits about 20 times a night, sometimes 50, and says the darnedest things Lately, “Wolf!” has been pretty common.
bonds, markets and oil are all starting to move as if the war and oil issue are now becoming a problem. it has started, just took a while. oil has been buffered by significant amounts of storage around the globe. as that storage disappears, the price will move up dramatically, imo. many people did not believe we would hit physical scarcity, but once it occurs, I think the reaction will be dramatic. trump is losing his ability to bully the markets into submission.
Massive SPR releases are certainly helping. The US SPR sold 9.9 million barrels this week. Japan has been lending barrels to refiners, who then opted to buy deferred to replenish them. This meant prompt cash weakened. And, the elephant is China. They are drawing from their massive inventory, and even resold some seaborne barrels. They also also are limiting product exports, like India, so some of the crude price gain is being reflected in products (e.g. diesel), which is why cracks (the spread between products and oil) are very high. In spite of these efforts, global commercial inventories are draining at a record pace.
Much of this can be summed up with one idea – complacency. The White House convinced the world and themselves that this blockage will be short lived. You’d be a fool to aggressively sell down your reserves if you thought it wasn’t. As the weeks roll on, the logic will be tested, and ultimately proven wrong.
The world should have meaningfully curtailed demand (via price and/or mandate) over the last months. Instead, governments have cut taxes, protected their own consumers via export quotas, and drained reserves. This will mean the necessary demand destruction in barrels will be compressed into a shorter time period, likely resulting in parabolic prices.
I’m not so sure. SPR mostly affects spot market and maybe the prompt. there is a little time arbitrage so it ripples down. but it is pretty “now” focused. you can look at the curve and see what the market sees happening in the future.
Right now it is extremely backwardated. Prompt (JUL) is 99 as I write this…and next month (AUG) is at 95. DEC is down to 82. This is the opposite of what you woudl expect from SPR distortions. should be lower now and higher in future.
Of course market might be wrong…but the betting Bayesian market predicts relief. That is the mean betting expectation.
Markets are indeed backwardated. Are they backwardated because they are predicting relief or in order to defer demand and pull out supply? Nearly 13 million barrels of production per day is shut in (not able to produce) because of the storage situation inside Hormuz. That is the largest outage in history. Even if the strait were opened tomorrow, all the trapped tankers would have to move out, more would have to come back in, they would need to load, relieving the capacity constraint that is preventing production. It would take months, in the best possible scenario, for production to resume to the levels they were before (assuming no reservoir damage). In those months, the market would still be in deficit because of the production shut-ins. And yet, the market is in backwardation during those months. Why? Because it’s not predicting relief, it’s pulling inventory out of every crevice it can by penalizing holding it due to backwardation. And it’s incentivizing the deferral of demand. It’s also begging for SPRs to loan barrels (e.g. Japan).
I don’t quite understand the math model, but my gut feel is that markets are sort of Bayesian and interpreting a lot of different information and synthesizing it. Expecting some sort of correlation like that to perform well, out of sample is just unlikely. A million stockpicking correlations have the same problem. At it’s worst you get technical analysis (not that I’m accusing you of that).
I remember James complaining about the market being irrationally too low when prices crashed in 2014, but they were just doing their best (which was imperfect, but not systemically so). Anyhow…it actually turned out that they were mostly not guessing as low as they should have. It got even worse. and for quite a while, not just a random wiggle.
Also, oil prices have huge uncertainty. you can see this if you look at the STEO “funnel graph” which is sort of a 90% CI for markets next year of prices…and routinely has ginormous floor to ceiling boundaries. aargh….they discontinued it! But here is an old one.
https://www.eia.gov/outlooks/steo/archives/uncertainty/uncertainty_past_wti.pdf
The point is there is actually a lot more financial “structure” in the market. You don’t have to just bet on months in the futures curve, which is a mean expectation, you can bet on specific outcomes (like $50 six months from now or whatever…like prop bets in sports). I believe this is what informed their old 5% and 90% CIs. But…if you look at those, you can see there are reasonable chances of much lower or much higher prices. The mean price you see is the market’s best guess on some average of all those probabilities (it has to be or there would be an arbitrage opportunity). But given that…don’t be too surprised that a price may look too high or too low…it could even be worse in reality within a 90% CI!
P.s. if you really think there is a real arbitrage opportunity between those two markets, some polymarket strait closed market and the oil price, go bet on it. I think if you are reluctant to do so, it’s probably because you sense there must be more to the story. Either the relationship of price to strait is not as strong as people think…or the definition in the betting market is flawed or whatever…but if you’re reluctant to take positions…it shows you don’t really see an arbitrage opportunity…more an opportunity to increase your analytical udnersstaning.
P.s.s. I’m not a statistician or an economist, so just take this as another hunch. But your training set seems very small (perhaps by neccsity, but still) and then the later part of the graph is small too. not a lot of months. I also don’t quite understand the M1 M2 numbers…or even the yellow and white. is that history and future?
Anonymous: M1, M2, M3 are short for January, February, March. Light orange shading denotes the US-Israel_Iran war.
M1 and shading makes sense in retrospective and thanks!
1. You talk about a regression equation being $10 too low, but I can’t see where that line is posted on the graph.
2. Also, perhaps a separate figure where you show that regression versus the inputs. Just how it developed, how well it does, etc. Not clear to me how well it fits. Also…you could interpret the lack of recent fitting as saying the market is misbehaving…or that having a bit more data shows the poor performance of that regression itself.
3. I think there is also sort of an issue of different time horizons. (More substantive comment.) Consider if the Strait is closed on 30JUN2026. That Strait closed market will go close to 100%, right? Since it just would be predicting tomorrow 01JUL looking like today, at that point. But the prompt or even spot (since there is time arbitrage) will not be really thinking about what happens on 01JUL (after all it is a day away and same as today)…but be worried about if Strait is closed on 01AUG…or 01OCT or even 01DEC. So…it would be pretty natural to expect the relationship to deviate at that time. Maybe that is a little already what you are seeing now? IOW, the “wiggles” of prompt/cash price versus Strait closed on 01JUL betting market worked well when that was something further away from the time of the spot/prompt. But we are already getting close enough to see some of the deviation which you would expect on 30JUN.