Everyday prices nowcasted to outstripping measured CPI and subindices:
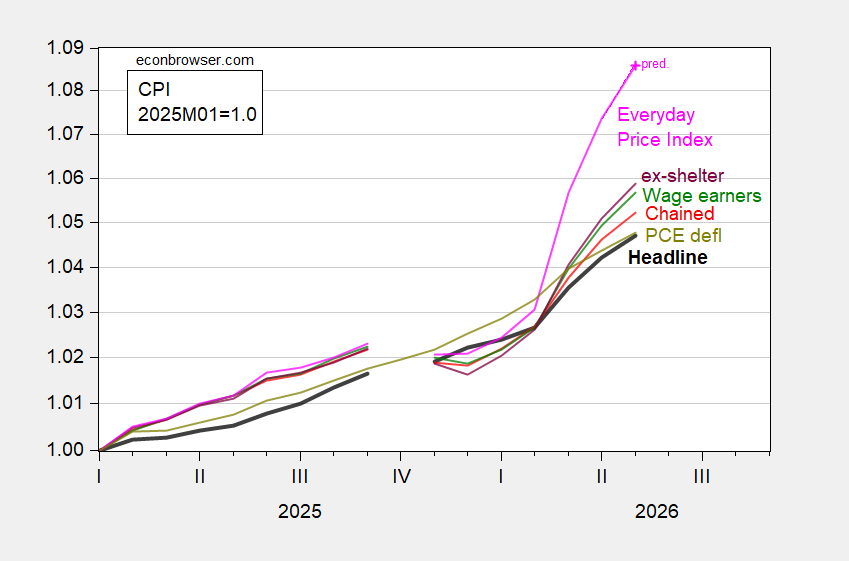
Figure 1: CPI-all urban (bold black), CPI wage earners and clerical (green), CPI ex-shelter (purple), CPI chained (red), PCE deflator (chartreuse), AIER Everday Price Index (pink), all 2025M01=1.0, on log scale. Chained CPI is n.s.a. April AIER EPI is nowcasted using CPI and gasoline price changes. May PCE deflator is nowcasted as of 6/10. Source: BLS, BEA via FRED, AIER, Cleveland Fed, and author’s calculations.
Interestingly, the CPI for wage earners and clerical workers is showing greater acceleration than that for all urban consumers (which is appropriate for about a household at about the 70th income percentile of income). By my estimate, “everyday prices” will have risen about 8.6% from January 2025, compared to 4.7% for headline CPI.
These differential inflation rates show up in calculations of the inflation-adjusted average hourly earnings.
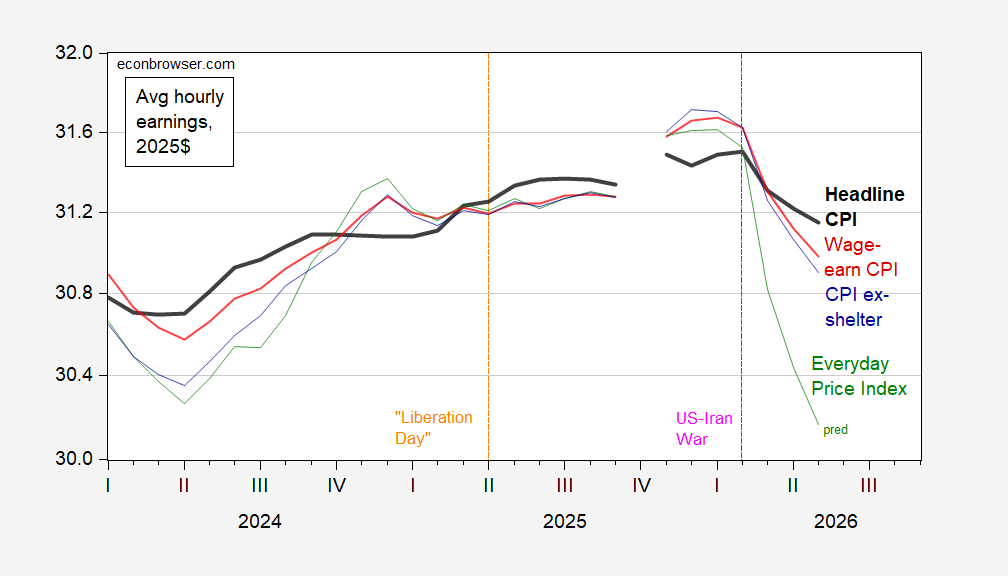
Figure 2: Average hourly wage in 2025$ using headline CPI (bold black), wage earner and clerical worker CPI (red), CPI ex-shelter (blue), and Everday Price Index (green). May Everyday Price Index estmated using reported CPI and gasoline price changes. Source: BLS, AIER, and author’s calculations.
The real wage defined using the CPI is back at January 2025 levels, while that using the wage earners CPI is 0.7 percentage points lower. Those consumers perceiving real wages using daily or weekly recurring costs will feel like those are down 3.4%.
On a y/y basis, core CPI in May was right about where it was a year ago, but up 0.3 ppts from February’s 2.5%. I will leave it to those with good models to say how far along spillover is from oil prices to core prices.
So far this month, gasoline prices are down a bit from a month ago, as are crude prices. Today’s restarting of the war-criminal-in-chief’s war boosted WTI by 3.4%, but so far, headline CPI for June has a chance of printing a decline. Fingers crossed.
Core prices in the U.S., I suspect, till now mostly reflect just the rise in input costs, not scarcity of finished goods. When the oil inventory squeeze hits, scarcity of final goods production is likely to become a greater problem which, in turn, will boost core prices. That’s especially true for imported goods and goods with lots of imported content, since the rest of the world will suffer more from physical scarcity of petroleum than will North America.
As noted in an earlier comment, oil exports through Hormuz have (had?) picked up to around 15% of pre-war volume. Kinda wonder whether the war criminal’s decision to renew violence in the Persian Gulf will cut into those new exports.
could some-one please tell me what the trimmed mean figure was at an annual rate?
https://fred.stlouisfed.org/series/TRMMEANCPIM158SFRBCLE/
3.18%.
Off topic, but only sort of – Four Senators (out of a hundred, mind you) addressing an actual, real public policy issue:
https://thehill.com/homenews/senate/5918842-bipartisan-senators-social-security/
The latest Trustee’s report has led four Senators to call for actual Congressional attention to the impending shortfall in the Social Security trust fund.
Odds are, legislation cannot be passed in the next Congress, because the narcissist-in-chief won’t take an interest and even if Democrats win control of both Chambers in November, the margins will be slim. Legislating a way to prevent a trust-fund shortfall is the work of the 121st Congress and the next president. However, building a coalition around a solution takes time, and Congress has dawdled at that quite long enough. If a handful of candidates sprinkle “save Social Security” into their campaign chatter this year, and then make it an issue for the coming presidential race, something other than a slapdash series of continuing resolutions could result.
By the way, with job growth weak, income growth skewed to those above the FICA limit, inflation high and rising, the current 6-year deadline for curtailing Social Security benefits may be optimistic. And the sooner it’s resolved, the less extreme and abrupt the solution needs to be.
I would start with increasing or eliminating the FICA limits, and keep the employer paying a part of that bill as well. that will go along way towards closing the gap. I exceed the limit, and not sure what I have done to justify that benefit of no longer paying the FICA costs? this problem has some easier fixes, if people address it today and not when the shortfall occurs.
Just abolish the trust fund and put Social Security on the general budget. There, done!
Yeah, but then every debt ceiling brouhaha would mean checks get delayed. Every new budget would have some idiot saying we need to change Social Security to please the Koch brothers. Probably worse things, too, that I haven’t thought of.
Macroduck: “Yeah, but then every debt ceiling brouhaha would mean checks get delayed.”
Yet that is exactly where we are now. SSA has said that checks will be reduced 22% unless the congressional brouhaha fixes it. Having Social Security off budget doesn’t guarantee anything. Mike Johnson just yesterday confirmed that he plans for Social Security cuts.
Having Social Security on budget means no more arguments about whether the fund has enough money. Checks get paid. The deficit is a separate issue that affects all spending. The days of Social Security running on autopilot are over.