Given positive Q1 GDP growth (albeit with downside surprise of 0.3% vs 0.5% q/q Bloomberg consensus, vs. 0.4% Melbourne Institute nowcast), there’s been a substantial amount of commentary regarding elevated recession risks [1] [2]. I find this surprising as the IMF’s April WEO projected 2% y/y growth for 2026 — of course conditional on a baseline that assumed eventually decreasing oil prices. On June 3, OECD projected 1.9%, while the latest Economist Intelligence Unit forecast is 1.6%. Eyeballing the RBA forecast as of June 2, it seems like their forecast is about 1.3%, still not negative growth.
First, consider GDP:
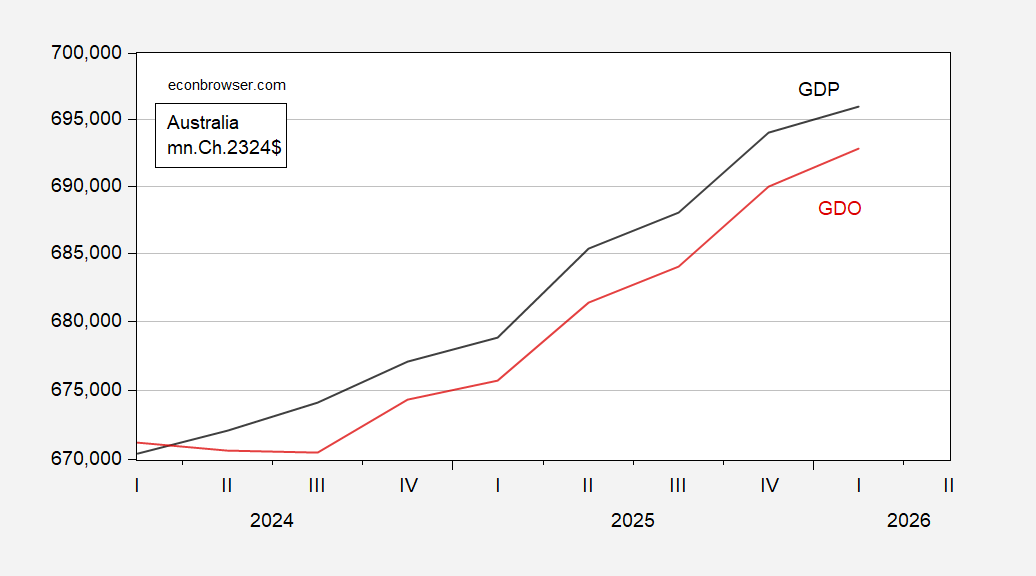
Figure 1: GDP (blue), average of GDP and GDI (red), all in mn.Ch.2024-25$, s.a., on a log scale. GDI from RBA. Source: ABS, RBA, and author’s calculations.
GDP grew 0.3% q/q in Q1, down from 0.9% in Q4. GDI grew faster, so what we would call GDO in the US exhibits 0.4% q/q growth; no special importance seems to be accorded this variable in Australia, though.
Second, consider aggregate demand proxies, as well as personal income.
In the US, “core GDP” has been the variable of focus, given the vagaries of measurement induced by trade policy. That variable accelerates into Q1.
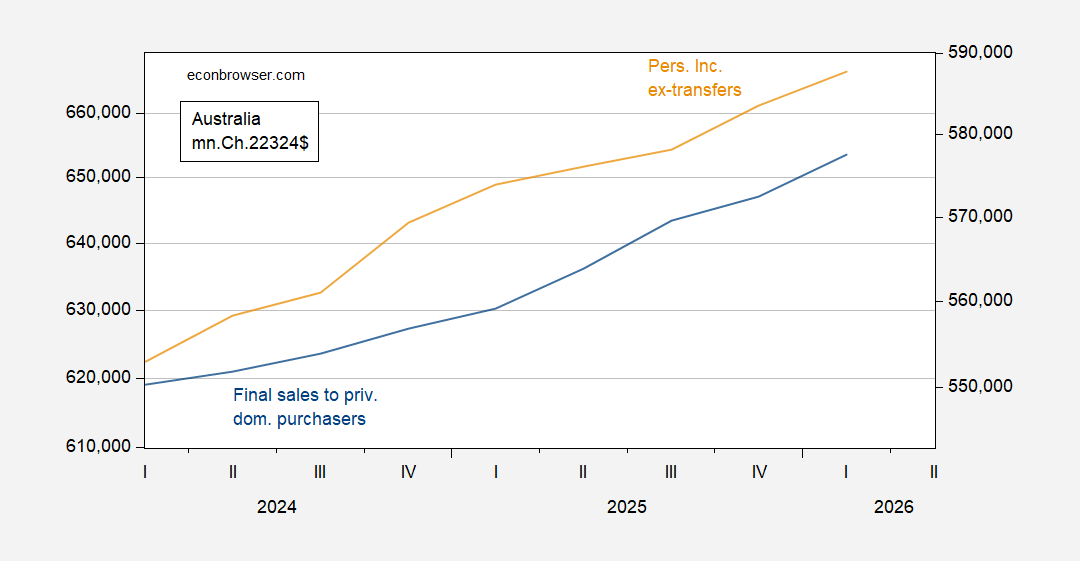
Figure 2: Final sales to private domestic purchasers (blue, left log scale), and personal income ex-transfers (tan, right log scale), both in mn.Ch.2023-24$, s.a. Source: ABS and author’s calculations.
For a relatively open economy like Australia, domestic final sales doesn’t seem particularly relevant. Perhaps more important for assessing momentum is final sales ex-government and public sector investment; growth decelerates from 0.6% to 0.2%, reflecting lower exports and higher imports. To the extent that key export destinations are in East Asia, their oil-shortage induced slowdown will impact Australia’s exports going forward. On the other hand, personal income derived from economic activity continued to grow into Q1.
Third, there’s employment. This is the only key indicator we have pertaining to Q2. In April employment declined from March, as the unemployment rate increased by 0.2 percentage points.
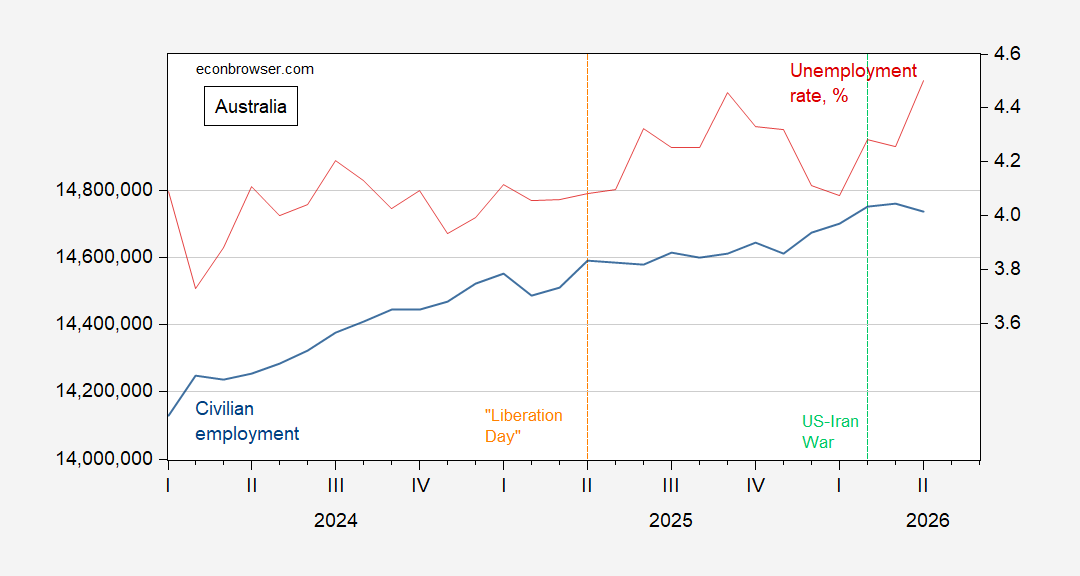
Figure 3: Australian civilian employment (blue, log scale), unemployment rate, % (red, right scale), s.a. Source: ABS.
Returning to the forecasts, it’s important to remember that each one is conditional upon some view about the evolution of oil prices, and hence the chances for reopening the Strait of Hormuz in a substantial way. As of today, the prediction market Kalshi put the probability of reopening by September 1st at 33%, an all time low for that bet.
Saw some of the trump welker interview. Wow. Trump has bo self control in addition to lack of reality. His mental state is beyond comprehension. For those who claimed a coverup of biden in the white house, what excuse do you have for what is happening with trump and his enablers?
The real concern is not what happened to growth in Q1, but rather what happens next. The slowdown in Asia is about to turn ugly, as oil inventories become critical. Australia imports the vast majority of its oil, so it’ll be hit harder soon.
A 0.3% rate of growth (that’s 1.1%, in American money) doesn’t seem to represent anything like “stall speed” for Australia:
https://fred.stlouisfed.org/graph/?g=1WOG9
Growth at that pace is not, in itself, a symptom of impending recession. The rise in the jobless rate an fall in employment are a concern, in a Sahm-rule sort of way.
Coal exports should be something of a buffer, though it seems unlikely to be enough. Indonesia is tightening up on coal exports, and most countries which have shifted away from coal probably have unused coal capacity to bring into service. That’s all good for Australia. Coal mining relies heavily on petroleum and electricity, so there could be a hitch in getting the stuff out of the ground.
Off topic – AI value added in the FT:
https://www.ft.com/content/8e9ae7a4-7209-4e2c-aa36-f3af77d6ce1f?syn-25a6b1a6=1
Sorry about the paywall. Here’s a chunk regarding the current business-use champion for AI, software coding:
“…coders created or edited almost 300 per cent more files — but that boost was halved to 150 per cent by the time they got to the number of discrete pieces of work submitted for review, and that in turn shrunk fivefold to a roughly 30 per cent uplift in the number of full software releases…. Moreover… the marked increase in mobile app releases over the past year has not been accompanied by any increase in downloads—most of the new apps fail to capture even a modest audience…”
So, more money out, but in many cases, no more money in. One speculates that the ability to generate software faster has meant the production of software getting ahead of ascertaining whether there’s demand.
I have been using AI for some coding updates. Simple stuff by computer science standards. Results are mixed. With significant oversight i can get pretty good code. But i have to be very active in the development. If i simply ask AI to do this job, i get something that sometimes works. The problem is it is near impossible to go edit and fix. AI is not a software replacement, yet.
Off topic – water as weapon:
https://asiatimes.com/2026/06/water-wars-washing-away-south-asias-fragile-peace/
The title is hyperbolic, but only because the author weote too narrowly. The problem described in the article is the end to a 66-year water agreement between India and Pakistan; the author tosses in Nepal and Bangladesh for good measure, but he’s reaching, based on his own text. Even so, it’s a big deal; hundreds of millions of people are affected.
The earliest recorded “international” water dispite was between Lagash and Umma around 2,500 BC. It lasted for roughly a century, though I’d guess more than conflict over water kept the war going. By one count, there have been 2,700 water conflicts between states have occurred through history. Fights over water break out pretty often, and give changes in climate and demand, there’s reason to expect more of ’em. In fact, there’s already a big jump in such conflicts. This is from the latest annual update of The World’s Water conflict chronology:
“The total number of recorded water – related conflict events has risen sharply over the past fifteen years. In 2010, only 21 events were documented. From 2011 through 2018, annual totals climbed steadily, surpassing 150 events by 2018. A brief decline occurr ed in 2019 and 2020, when events dropped to 137 and 95, respectively —likely reflecting a temporary easing of violence in parts of the Middle East and the global slowdown caused by the COVID – 19 pandemic. The trend reversed in 2021 with 139 recorded events, followed by dramatic surges of 70% and 50% in 2022 and 2023. Growth continued in 2024, with an additional 18% increase over the previous year. These recent spikes correspond with the intensification of conflicts in Israel – Palestine and Russia – Ukraine, as w ell as escalating disputes over inadequate water access in Africa, Latin America, and South Asia, and mounting tensions over drought – driven scarcity in India, Iran, and other regions.”
https://www.worldwater.org/water-conflict/
In the India/Pakistan case, Hindu nationalism and authoritarian tendencies are part of what’s going on, but it’s clear from the global pattern that those factors are not neccessary to spur conflict. Aside from climate change and increasing demand, the U.S. withdrawal from the world during the war-criminal I administration and again in war-criminal II may play a role in the recent sharp upswing.
Anyhow, water conflict is one more factor suggest that the post-WWII era of relative peace is ending.
Off topic – Partial closure of Bab el-Mandeb?:
“Yemen’s Houthi group said on Monday that they will impose “a complete and total ban” on Israeli maritime navigation in the Red Sea, stating that Israeli-linked vessels in the waterway will again be targeted.”
https://www.aa.com.tr/en/middle-east/houthis-declare-total-ban-on-israeli-maritime-navigation-in-red-sea/3959887
That is not a ban on oil exports, so not bad for the rest of us. It is an escalation, and a display of power by Yemen’s Houthis. It is prone to draw a response from Israel. If the Houthis prove good at limiting traffic, that’ll be a worry for the roughly 10% of global oil exports that transit Bab el-Mandeb.
Kuwait is back to shipping oil through the Strait of Hormuz:
https://oilprice.com/Latest-Energy-News/World-News/Kuwait-Offers-First-Crude-Cargoes-to-Asia-since-Iran-War-Started.html
One possible explanation is that Kuwait is paying tolls to Iran. Could he why Brent is near the lowest price of the war. If Kuwait is going to get back to exporting by paying tolls, others may as well. New normal, maybe.
More on oil getting through Hormuz:
https://www.fool.com/investing/2026/06/09/oil-is-quietly-escaping-the-strait-of-hormuz-what-it-means-for-oil-stocks/
“Advisor +948%
The Motley Fool
Top 10 Stocks to Buy Now ›
S&P 500
7,386.65
-0.3%
-19.08
DJI
50,872.11
+0.2%
+86.10
NASDAQ
25,678.82
-1.0%
-250.84
Bitcoin
$62,078.00
-2.4%
-$1,531.19
AAPL
$290.65
-3.6%
-$10.89
AMZN
$244.30
-0.4%
-$0.92
GOOG
$362.29
+0.3%
+$1.12
META
$584.71
-0.1%
-$0.68
MSFT
$403.52
-2.0%
-$8.22
NVDA
$207.74
-0.4%
-$0.90
TSLA
$396.84
-3.0%
-$12.11
Free ArticleExplore Premium Services
Oil is Quietly Escaping the Strait of Hormuz. What it Means for Oil Stocks.
More oil could be flowing out of the Persian Gulf than tracking sources suggest.
By Matt DiLallo – Jun 9, 2026 at 2:03PM EST
Follow us
Share
Summarize with AI
Key Points
Iran has been impeding tanker traffic through the Strait of Hormuz since the war began.
Some ships are getting through by paying tolls to Iran, while others are quietly moving through at night with their transponders off.
These volumes aren’t enough to offset the looming supply crisis as oil inventory levels drain towards operational minimums.
Motley Fool Issues Rare “Highest Conviction” Buy Alert ›
Around 20 million barrels of oil per day (BPD) traversed the Strait of Hormuz before the war with Iran. That accounted for about 25% of the global seaborne oil trade and around 20% of the total global supply. According to tanker tracking data, oil flows through the Strait of Hormuz have slowed to a trickle since the war with Iran began.
However, that trickle might be bigger than first thought. Some ships are paying tolls to Iran while others are quietly escaping the Strait at night with their transponders off. These additional flows are helping keep oil prices down. Here’s a look at what it means for oil stocks.
An oil tanker on the water at dusk.
Image source: Getty Images.
The “ghost” fleet
According to a JPMorgan estimate, visible traffic through the Strait of Hormuz is only about 15% of the pre-war level. That suggests there’s a massive energy supply gap. Pipelines bypassing the Strait of Hormuz (Saudi Arabia’s 7 million BPD East-West Pipeline and the 1.8 million BPD Abu Dhabi Crude Oil Pipeline) are helping offset some of this gap. Meanwhile, higher oil prices are causing some demand destruction. The world is making up the remaining shortfall by drawing down excess inventory and tapping emergency stockpiles, such as the U.S. Strategic Petroleum Reserve.
However, many oil market analysts believe that there’s additional oil flowing out of the Persian Gulf through “ghost” fleets. According to an estimate by Piper Sandler, around 2.9 million BPD made it through the Strait of Hormuz last month. That includes about 2.1 million BPD from tankers that paid tolls to Iran and another 900,000 BPD of “ghost” transits, tankers that quietly escaped in the dark with their transponders off.”
That 2.9 million bpd estimate amounts to 14.5% of the daily pre-war volume. At a dollar a barrel tariff, that’s $2.1 million per day for Iran. Now that Kuwait is joining the party, the volume of oil getting through Hormuz rising, as is Iran’s income fron tolls. At some pount, we reach a new equilibrium, without the U.S. getting a “deal”. Iran gets a wasteland a d calls it “peace”.
We’ll see.