From BEA:
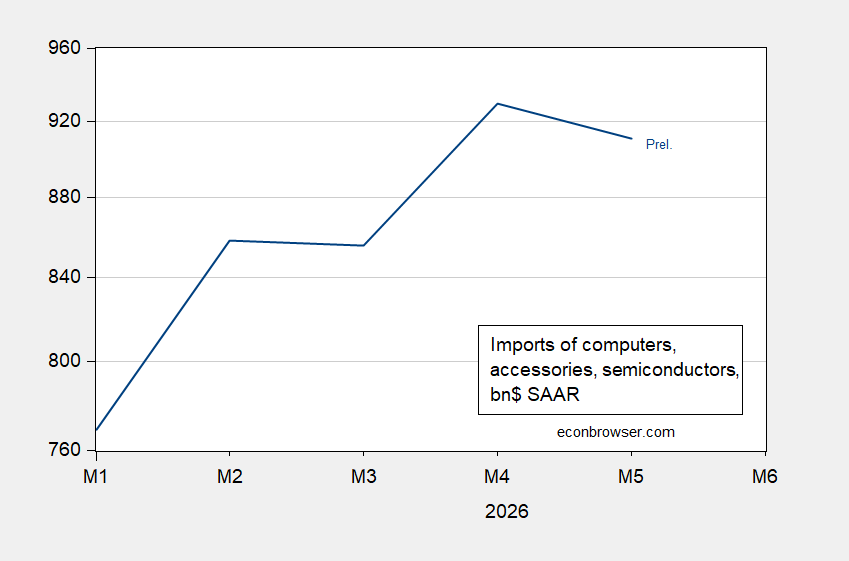
Figure 1: Computer, computer accessories, semiconductor imports, bn.$, SAAR, on log scale. Source: BEA.
That being said, the May data are preliminary. Here are monthly data spliced to quarterly:
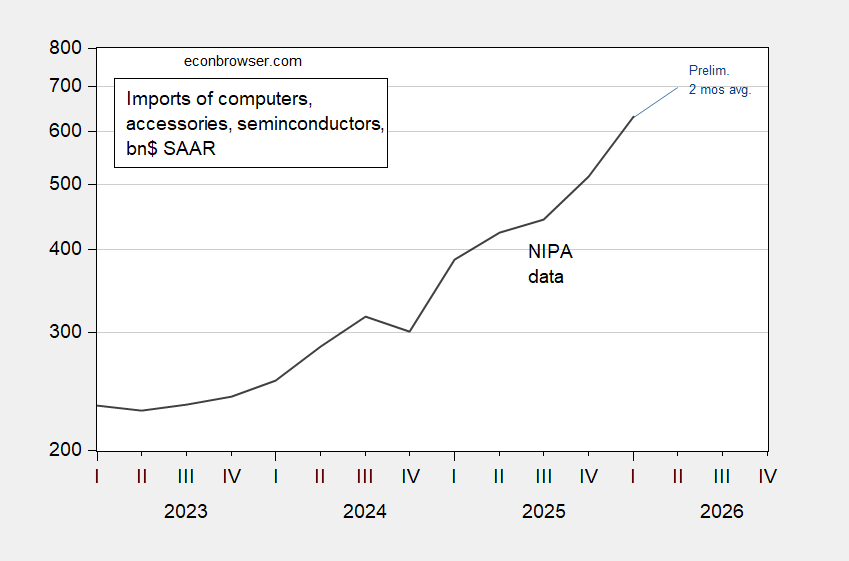
Figure 2: Computer, computer accessories, semiconductor imports, NIPA data (black), monthly trade releases, spliced to NIPA at 0.93 ratio for Q1 (blue), bn.$, SAAR, on log scale. 2026Q2 is average for April and May. Source: BEA and author’s calculations.
I’ve love you to put up a recent Dallas FED paper which Trump is grossly misrepresenting to claim immigrants drove up housing prices by 30%. Yikes. Oh wait the total rise in housing prices under Biden was only 22% per the report which said immigration was responsible for a 6.6% rise. Yes boys and girls… 6.6/22 = 0.3!
Current lack of labor is going to drive house prices up in the medium term. We are likely to first see a drop in lot purchasing, then housing starts, then (after the temporary supply from kicking out immigrants is used up) a severe lack of supply.
And Trump is claiming foreign companies are making these in the USA with that alleged $17 trillion in new investments. Made up numbers? Of course.